Introducing Veneur: high performance and global aggregation for Datadog
When a company writes about their observability stack, they often focus on sweet visualizations, advanced anomaly detection or innovative data stores. Those are well and good, but today we’d like to talk about the tip of the spear when it comes to observing your systems: metrics pipelines! Metrics pipelines are how we get metrics from where they happen—our hosts and services—to storage quickly and efficiently so they can be queried, all without interrupting the host service.
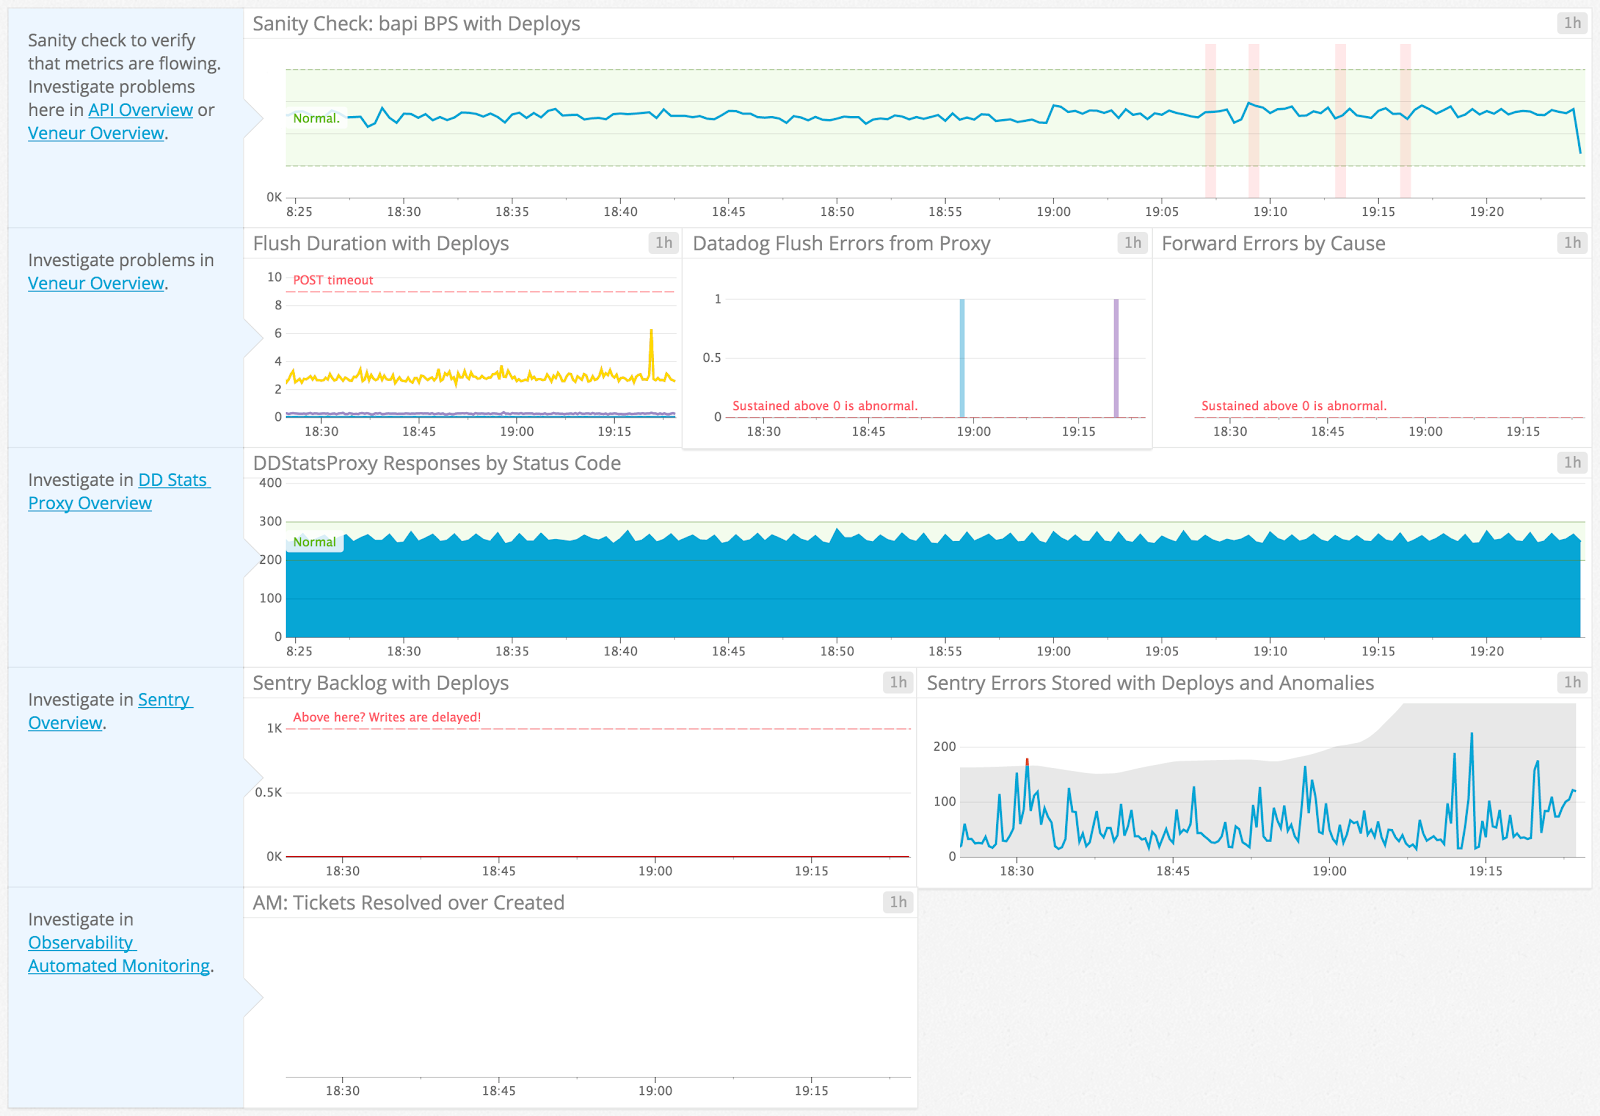
First, let’s establish some technical context. About a year ago, Stripe started the process of migrating to Datadog. Datadog is a hosted product that offers metric storage, visualization and alerting. With them we can get some marvelous dashboards to monitor our Observability systems:

Observability Overview Dashboard
Previously, we’d been using some nice open-source software but it was sadly unowned and unmaintained internally. Facing the high cost—in money and people—we decided that outsourcing to Datadog was a great idea. Nearly a year later, we’re quite happy with the improved visibility and reliability we’ve gained through significant effort in this area. One of the most interesting aspects of this work was how to even metric!
Using StatsD for metrics
There are many ways to instrument your systems. Our preferred method is the StatsD style: a simple text-based protocol with minimal performance impact. Code is instrumented to emit UDP to a central server at runtime whenever measured stuff happens.
Like all of life, this choice has tradeoffs. For the sake of brevity, we’ll quickly mention the two downsides of StatsD that are most relevant to us: its use of inherently unreliable UDP, and its role as a Single Point of Failure for timer aggregation.
As you may know, UDP is a “fire and forget” protocol that does not require any acknowledgement by the receiver. This makes UDP pretty fast for the client, but also means that client has no way to ensure that the metric was received by anyone! When combined with the network and the host’s natural protections that cause traffic to be dropped, you’ve got a problem.
Another problem is the Single Point of Failure. The poor StatsD server has to process a lot of UDP packets if you’ve got a non trivial number of sources. Add to that the nightmare of the machine going down and the need to shard or use other tricks to scale out, and you’ve got your work cut out for you.
DogStatsD and the lack of “global”
Aware that a central StatsD can be a problem for some, Datadog takes a different approach: Each host runs an instance of DogStatsD as part of the Datadog agent. This neatly sidesteps most performance problems but created a large feature regression for Stripe: no more global percentiles. Datadog only supports per-host aggregations for histograms, timers and sets.
Remember that, with StatsD, you emit a metric to the downstream server each time the event occurs. If you’re measuring API requests and emitting that metric on each host, you are now sending your timer metric to the local Datadog agent which aggregates them and flushes them to Datadog’s servers in batches. For counters, this is great because you can just add them together! But for percentiles we’ve got problems. Imagine you’ve got hundreds of servers each doing an unequal number of API requests with unequal workloads. Our percentiles are not representative of how our whole API is behaving. Even worse, once we’ve generated the percentiles for our histograms there is no meaningful way, mathematically, to combine them. (More precisely, the percentiles of arbitrary subsamples of a distribution are not sufficient for the percentiles of the full distribution).
Stripe needs to know the overall percentiles because each host’s histogram only has a small subset of random requests. We needed something better!
Enter Veneur
To provide these features to Stripe we created Veneur, a DogStatsD server with global aggregation capability. We’re happily running it in production and you can too! It’s open-source and we’d love for you to take a look.
Veneur runs in place of Datadog’s bundled DogStatsD server, listening on the same port. It flushes metrics to Datadog just like you’d expect. That’s where the similarities end, however, and the magic begins.
Instead of aggregating the histogram and emitting percentiles at flush time, Veneur forwards the histogram on to a global Veneur instance which merges all the histograms and flushes them to Datadog at the next window. It adds a bit of delay—one flush period—but the result is a best-of-both mix of local and global metrics!

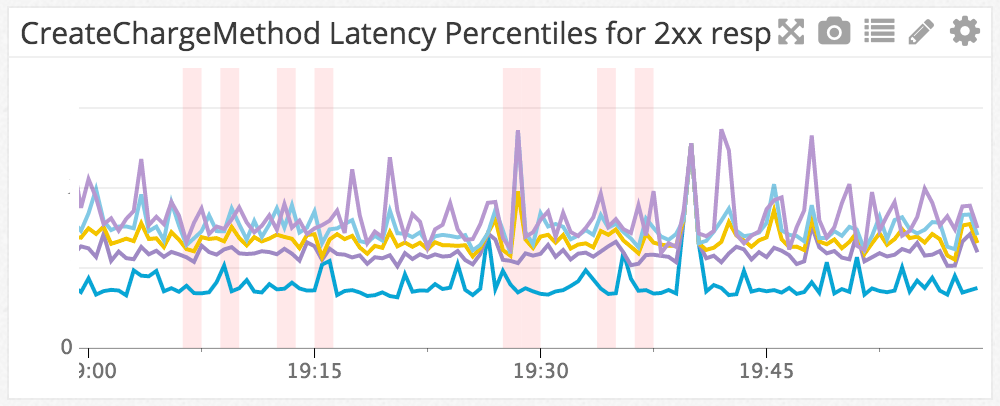
We monitor the performance of many of our API calls, such as this chart of various percentiles for creating a charge. Red bars are deploys!
Approximate, mergeable histograms
As mentioned earlier, the essential problem with percentiles is that, once reported, they can’t be combined together. If host A received 20 requests and host B received 15, the two numbers can be added to determine that, in total, we had 35 requests. But if host A has a 99th percentile response time of 8ms and host B has a 99th percentile response time of 10ms, what’s the 99th percentile across both hosts?
The answer is, “we don’t know”. Taking the mean of those two percentiles results in a number that is statistically meaningless. If we have more than two hosts, we can’t simply take the percentile of percentiles either. We can’t even use the percentiles of each host to infer a range for the global percentile—the global 99th percentile could, in rare cases, be larger than any of the individual hosts’ 99th percentiles. We need to take the original set of response times reported from host A, and the original set from host B, and combine those together. Then, from the combined set, we can report the real 99th percentile across both hosts. That’s what forwarding is for.
Of course, there are a few caveats. If each histogram stores all the samples it received, the final histogram on the global instance could potentially be huge. To sidestep this issue, Veneur uses an approximating histogram implementation called a t-digest, which uses constant space regardless of the number of samples. (Specifically, we wrote our own Go port of it.) As the name would suggest, approximating histograms return approximate percentiles with some error, but this tradeoff ensures that Veneur’s memory consumption stays under control under any load.
Degradation
The global Veneur instance is also a single point of failure for the metrics that pass through it. If it went down we would lose percentiles (and sets, since those are forwarded too). But we wouldn’t lose everything. Besides the percentiles, StatsD histograms report a counter of how many samples they’ve received, and the minimum/maximum samples. These metrics can be combined without forwarding (if we know the maximum response time on each host, the maximum across all hosts is just the maximum of the individual values, and so on), so they get reported immediately without any forwarding. Clients can opt out of forwarding altogether, if they really do want their percentiles to be constrained to each host.

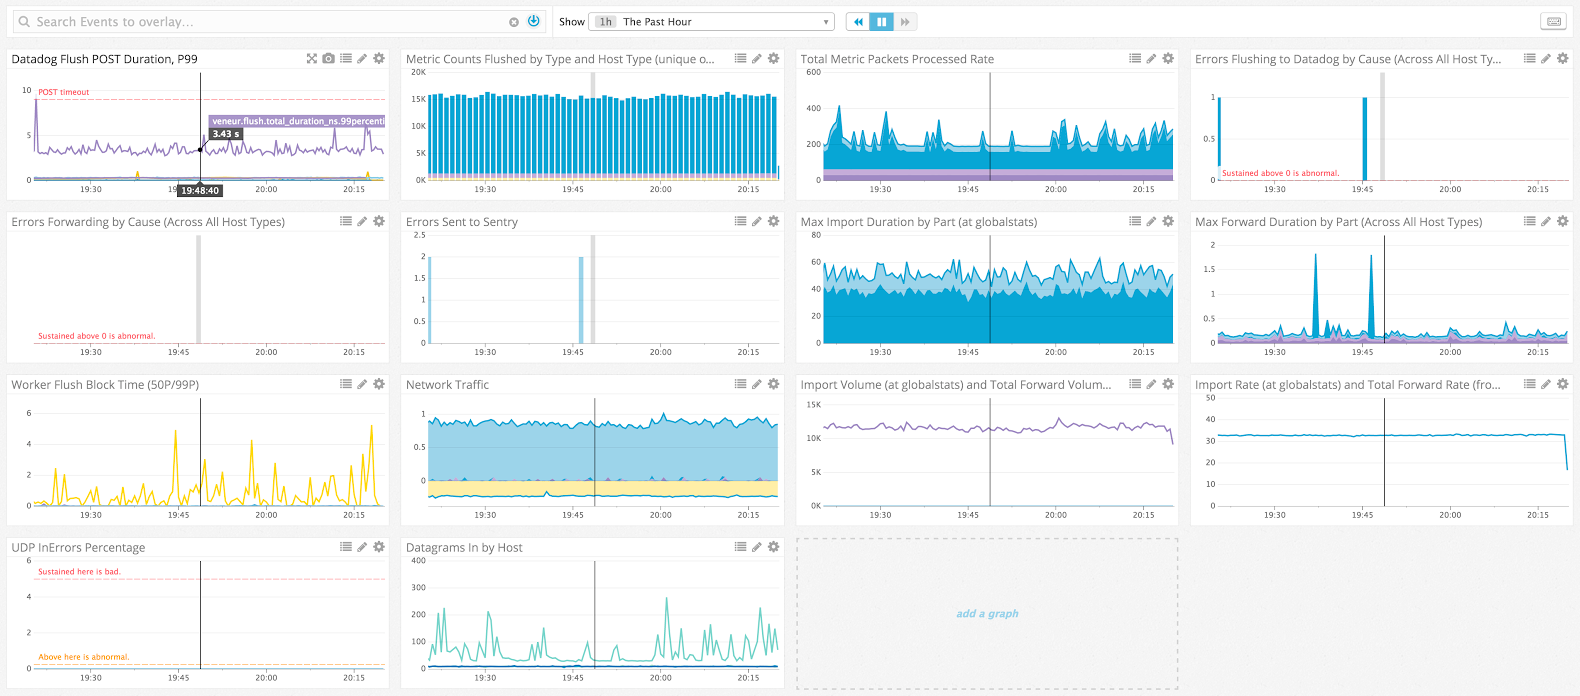
Veneur’s Overview Dashboard, well instrumented and healthy!
Other cool features and errors
Veneur—named for the Grand Huntsman of France, master of dogs!—also has a few other tricks:
- Drop-in replacement for Datadog’s included DogStatsD. It even processes events and service checks!
- Written in Go to minimize deployment troubles to a single binary
- Use of HyperLogLogs for counting the unique members of a set efficiently with fixed memory consumption
- Extensive metrics (natch) so you can watch the watchers
- Efficient compressed, chunked POST requests sent concurrently to Datadog’s API
- Extremely fast
Over the course of Veneur’s development we also iterated a lot. Our initial implementation was purely a global DogStatsD implementation without the forwarding or merging. It was really fast, but we quickly decided that processing more packets faster wasn’t really going to get us very far.
Next we took some twists and turns through “smart clients” that tried to route metrics to the appropriate places. This was initially promising, but we found that supporting this for each of our language runtimes and use cases was prohibitively expensive and undermined (Dog)StatsD’s simplicity. Some of our instrumentation is as simple as an nc command and that simplicity is very helpful to quickly instrument things.
While overall our work was transparent, we did cause some trouble when we initially turned the global features back on. Some teams had come to rely on per-host for very specific metrics. When we had to fail back to host local for some refactoring, we caused problems to teams who had just adapted to using global features. Argh! Each of these wound up being positive learning experiences, and we found Stripe’s engineers to be very accommodating. Thanks!
Thanks and future work
The Observability team would like to thank Datadog for their support and advice in the creation of Veneur. We’d also like to thank our friends and teammates at Stripe for their patience as we iterated to where we are today. Specifically for the occasional broken charts, metrics outages and other hilarious-in-hindsight problems we caused along the way.
We’ve been running Veneur in production for months and have been enjoying the fruits of our labor. We’re now operating at a stable, more mature pace for improvements around efficiency learned from monitoring its production behavior. We hope to leverage Veneur in the future for continued improvements to the features and reliability of our metrics pipeline. We’ve discussed additional protocol features, unified formats, per-team accounting and even incorporating other sensor data like tracing spans. Veneur’s speed, instrumentation and flexibility give us lots of room to grow and improve. Someone’s gotta feed those wicked cool visualizations and anomaly detectors!
