การประเมินความเสี่ยงจากการฉ้อโกงเป็นกระบวนการต่อเนื่องในการระบุเวกเตอร์ รูปแบบ และสถานการณ์จำลองในการโจมตี รวมถึงการลดความเสี่ยงเหล่านั้น จากการทำงานร่วมกับผู้ใช้อย่างใกล้ชิด ทีมบริการเฉพาะทางของเราพบว่าธุรกิจที่ดำเนินการดังกล่าวได้อย่างมีประสิทธิภาพสูงสุดมักจะมีนักวิเคราะห์การฉ้อโกงและนักวิเคราะห์ข้อมูลทำงานร่วมกัน โดยใช้ Stripe Radar for Fraud Teams ร่วมกับผลิตภัณฑ์ Stripe Data เช่น Stripe Sigma หรือ Stripe Data Pipeline เพื่อระบุทั้งรูปแบบการฉ้อโกงทั่วไปและรูปแบบเฉพาะของธุรกิจ
Radar for Fraud Teams จะช่วยตรวจจับและป้องกันการฉ้อโกง และช่วยให้คุณสร้างการตั้งค่าการฉ้อโกงที่ออกแบบเองซึ่งเหมาะกับธุรกิจของคุณ โดยมีกฎที่กำหนดเอง การรายงาน และการตรวจสอบด้วยตนเอง โดย Stripe Sigma เป็นโซลูชันการรายงานที่ทำให้ข้อมูลการทำธุรกรรม การเปลี่ยนเป็นผู้ใช้แบบชำระเงิน และข้อมูลลูกค้าของคุณพร้อมใช้งานภายในสภาพแวดล้อมแบบอินเทอร์แอกทีฟในแดชบอร์ด Stripe ส่วน Data Pipeline จะให้ข้อมูลเดียวกัน แต่จะส่งข้อมูลไปยังคลังข้อมูลของ Snowflake หรือ Redshift ของคุณโดยอัตโนมัติ เพื่อให้สามารถเข้าถึงได้ควบคู่ไปกับข้อมูลธุรกิจอื่นๆ ของคุณ
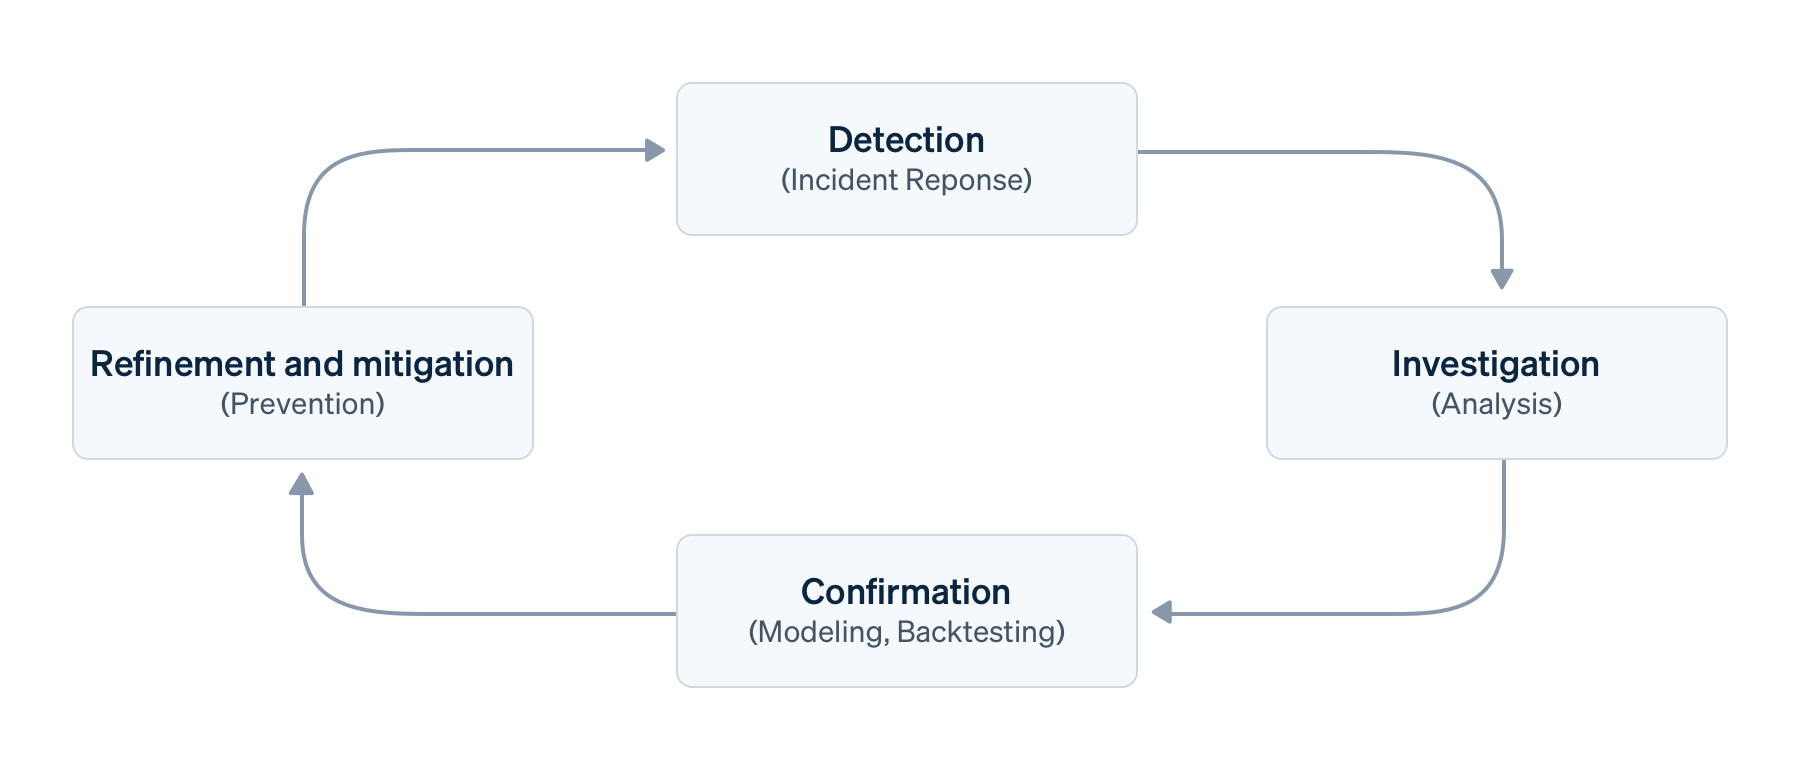
เครื่องมือเหล่านี้ทำงานร่วมกันได้อย่างราบรื่นเพื่อครอบคลุมเสาหลักทั้งสี่ของกระบวนการจัดการการฉ้อโกงที่มีประสิทธิภาพ ประกอบด้วย การตรวจจับ การตรวจสอบ การยืนยัน รวมถึงการปรับแต่งและการลดความเสี่ยง ซึ่งเราจะอธิบายโดยละเอียดเพิ่มเติม
ประโยชน์ของการใช้ Radar for Fraud Teams ร่วมกับ Stripe Sigma หรือ Data Pipeline
วัตถุประสงค์หลักในการใช้ Radar for Fraud Teams ร่วมกับ Stripe Sigma หรือ Data Pipeline คือการวิเคราะห์ข้อมูลของ Radar เช่น ข้อมูลเมตา ควบคู่ไปกับข้อมูลของคุณเอง รวมถึงการอนุมัติล่วงหน้า เส้นทางของผู้ใช้ การเปลี่ยนเป็นผู้ใช้แบบชำระเงิน และข้อมูลเซสชัน เพื่อแยกธุรกรรมที่ถูกต้องออกจากพฤติกรรมของลูกค้าที่เป็นการฉ้อโกง
- เวลาในการให้ข้อมูลเชิงลึก เพื่อตรวจจับและป้องกันการฉ้อโกงในเชิงรุก
- เวลาตอบสนองในการพัฒนากฎการป้องกันและการตรวจจับ
- ค่าใช้จ่ายในการฉ้อโกง ซึ่งรวมถึงการคืนเงิน ค่าธรรมเนียมการโต้แย้งการชำระเงิน การเลิกใช้บริการของลูกค้า และการปฏิเสธการชำระเงินของบริษัทผู้ออกบัตร
รายงาน สถานะของการฉ้อโกงออนไลน์ ของเราแสดงให้เห็นถึงภาระในการปฏิบัติงานของกระบวนการตรวจสอบด้วยตนเอง และยิ่ง "[บริษัท]มีขนาดใหญ่เท่าใด สัดส่วนธุรกรรมที่ตรวจสอบก็จะยิ่งน้อยลงเท่านั้น" การทำให้กระบวนการเหล่านี้เป็นระบบอัตโนมัติจะช่วยให้นักวิเคราะห์การฉ้อโกงมีเวลามากขึ้นในการระบุเวกเตอร์การโจมตีใหม่ๆ และพัฒนากฎการป้องกันและการตรวจจับต่างๆ ซึ่งหมายความว่าคุณสามารถสร้างสมดุลที่ดีขึ้นระหว่างการบล็อกการใช้งานที่เป็นการฉ้อโกงและลดความยุ่งยากสำหรับลูกค้าที่ถูกต้อง (การเลิกใช้บริการ)
ขั้นตอนการจัดการการฉ้อโกงธุรกรรมพื้นฐาน
สมมติว่าคุณมีขั้นตอนการจัดการการฉ้อโกงธุรกรรมพื้นฐาน ได้แก่ การตรวจจับ การตรวจสอบ การยืนยัน รวมถึงการปรับแต่งและการลดความเสี่ยงที่เกิดขึ้นภายในกรอบความเสี่ยงที่ใหญ่ขึ้น

- การตรวจจับ หรือที่เรียกว่าการระบุตัวตน การคาดการณ์ หรือการตอบสนองต่อเหตุการณ์ คือการค้นพบจุดข้อมูลที่ต้องมีการตรวจสอบเพิ่มเติม การตรวจจับอาจเป็นแบบที่ดำเนินการด้วยตนเอง (เช่น ระหว่างเหตุการณ์), แบบกึ่งอัตโนมัติ (ผ่านกฎการตรวจจับหรือการตรวจสอบโดยเทียบกับข้อมูลเบื้องต้นของคุณ), อัตโนมัติ (ผ่านแมชชีนเลิร์นนิงหรือการตรวจจับความผิดปกติ) หรือกระตุ้นจากภายนอก (เช่น คำติชมของลูกค้าหรือการโต้แย้งการชำระเงิน) เมื่อมีการตรวจจับ แมชชีนเลิร์นนิงของ Radar จะสามารถค้นหารูปแบบการฉ้อโกงที่พบบ่อยได้โดยอัตโนมัติ ในขณะที่ Stripe Sigma ช่วยให้คุณสามารถค้นหารูปแบบเฉพาะสำหรับธุรกิจของคุณได้
- การตรวจสอบ หรือการวิเคราะห์เชิงสำรวจ คือการประเมินการชำระเงินหรือพฤติกรรมที่น่าสงสัยเพื่อทำความเข้าใจผลกระทบทางธุรกิจให้ดียิ่งขึ้น ซึ่งมักเกี่ยวข้องกับการตรวจสอบกับข้อมูลในวงกว้างเพื่อขจัดสัญญาณรบกวน โดยทั่วไป นักวิเคราะห์การฉ้อโกงจะใช้คิวตรวจสอบของ Radar หรือแดชบอร์ดการชำระเงินของ Stripe เพื่อตรวจสอบ
- การยืนยัน หรือที่เรียกว่าการจำลองหรือการทดสอบย้อนหลัง คือการนำเวกเตอร์การโจมตีฉ้อโกงที่ผ่านการตรวจสอบแล้วไปขยายเป็นมิติและตัวเลือกโมเดล นอกจากนี้ยังครอบคลุมถึงการตรวจสอบความถูกต้องและการประเมินผลกระทบโดยใช้ข้อมูลในอดีตและเปรียบเทียบกับกฎอื่นๆ ฟังก์ชันการทดสอบย้อนหลังและการจำลองของ Radar สามารถช่วยให้นักวิเคราะห์การฉ้อโกงสามารถทำเช่นนี้ได้ แต่วิศวกรข้อมูลสามารถใช้ Stripe Sigma ได้ในสถานการณ์ที่หลากหลายยิ่งขึ้น
- การปรับแต่งและการลดความเสี่ยง บางครั้งเรียกว่าการดำเนินการ หรือการจำกัดขอบเขต คือการนำแบบจำลองไปใช้งาน โดยการจับคู่มิติและคุณสมบัติสำคัญๆ กับกฎ Radar เพื่อป้องกัน ตรวจสอบ หรือเปลี่ยนเส้นทางของการฉ้อโกง โดยปกติแล้ว กฎเหล่านี้จะเป็นกฎการป้องกันแบบคงที่ แต่ในปัจจุบันแมชชีนเลิร์นนิงถือเป็นส่วนสำคัญที่เทียบเท่ากับมนุษย์และเป้าหมายคือการเพิ่มความแม่นยำ คำว่าการปรับแต่งจึงเหมาะสมกว่า โดยปกติแล้วจะประกอบด้วยกฎการบล็อกหรือรายการใน Radar
การนำกระบวนการนี้ไปใช้ขั้นพื้นฐานอาจเกี่ยวข้องกับรอบซ้ำๆ เช่น การตรวจสอบรายวัน การสปรินต์ หรือการเผยแพร่การตั้งค่าการตรวจจับการฉ้อโกงตามกฎ อย่างไรก็ตาม เนื่องจากระยะเวลาของรอบอาจแตกต่างกันและวงจรป้อนกลับสามารถเกิดขึ้นพร้อมกันได้ เราจึงต้องการให้การดำเนินการนี้เป็นกระบวนการต่อเนื่อง
ต่อไป เราจะมาดูแต่ละส่วนของเสาหลักทั้งสี่นี้โดยละเอียดในบริบทของสถานการณ์จำลองสมมติ และแสดงให้คุณเห็นว่า Radar for Fraud Teams และ Stripe Sigma หรือ Data Pipeline สามารถช่วยได้อย่างไร
สถานการณ์จำลองของเรา
ในสถานการณ์จำลองสมมติ เราจะวิเคราะห์พฤติกรรมที่เกิดขึ้นในช่วงเวลาหนึ่งๆ แทนที่จะเป็นการเพิ่มขึ้นอย่างกะทันหัน
สมมติว่าคุณทำธุรกิจอีคอมเมิร์ซ คุณได้ตั้งค่าการตรวจสอบ Webhook ไว้ในชุดการสังเกตการณ์ของคุณ ซึ่งจะแสดงแผนภูมิต่างๆ สำหรับแนวโน้มการชำระเงินแบบเรียลไทม์ คุณได้สังเกตเห็นว่าปริมาณการปฏิเสธการชำระเงินจากแบรนด์บัตรชื่อ "Mallory" เพิ่มขึ้นอย่างต่อเนื่องในช่วงไม่กี่วันที่ผ่านมา ซึ่งเป็นผลิตภัณฑ์ที่ปกติแล้วไม่ได้ขายในภูมิภาคที่บัตรแบรนด์นี้เป็นที่นิยมใช้กัน (หมายเหตุ: Mallory เป็นแบรนด์บัตรสมมติที่เราใช้เพื่อทำให้สถานการณ์จำลองนี้เป็นจริง ตัวอย่างเช่น แบรนด์นี้อาจเป็นแบรนด์ที่ไม่ได้อยู่ในเครือข่าย Enhanced Issuer Network) ไม่มีโปรโมชั่นลดราคาหรือเหตุการณ์อื่นๆ ที่สามารถอธิบายการเปลี่ยนแปลงนี้ได้ ดังนั้นทีมของคุณจึงต้องตรวจสอบสิ่งที่เกิดขึ้นและตัดสินใจดำเนินการต่อไป
การตรวจจับ
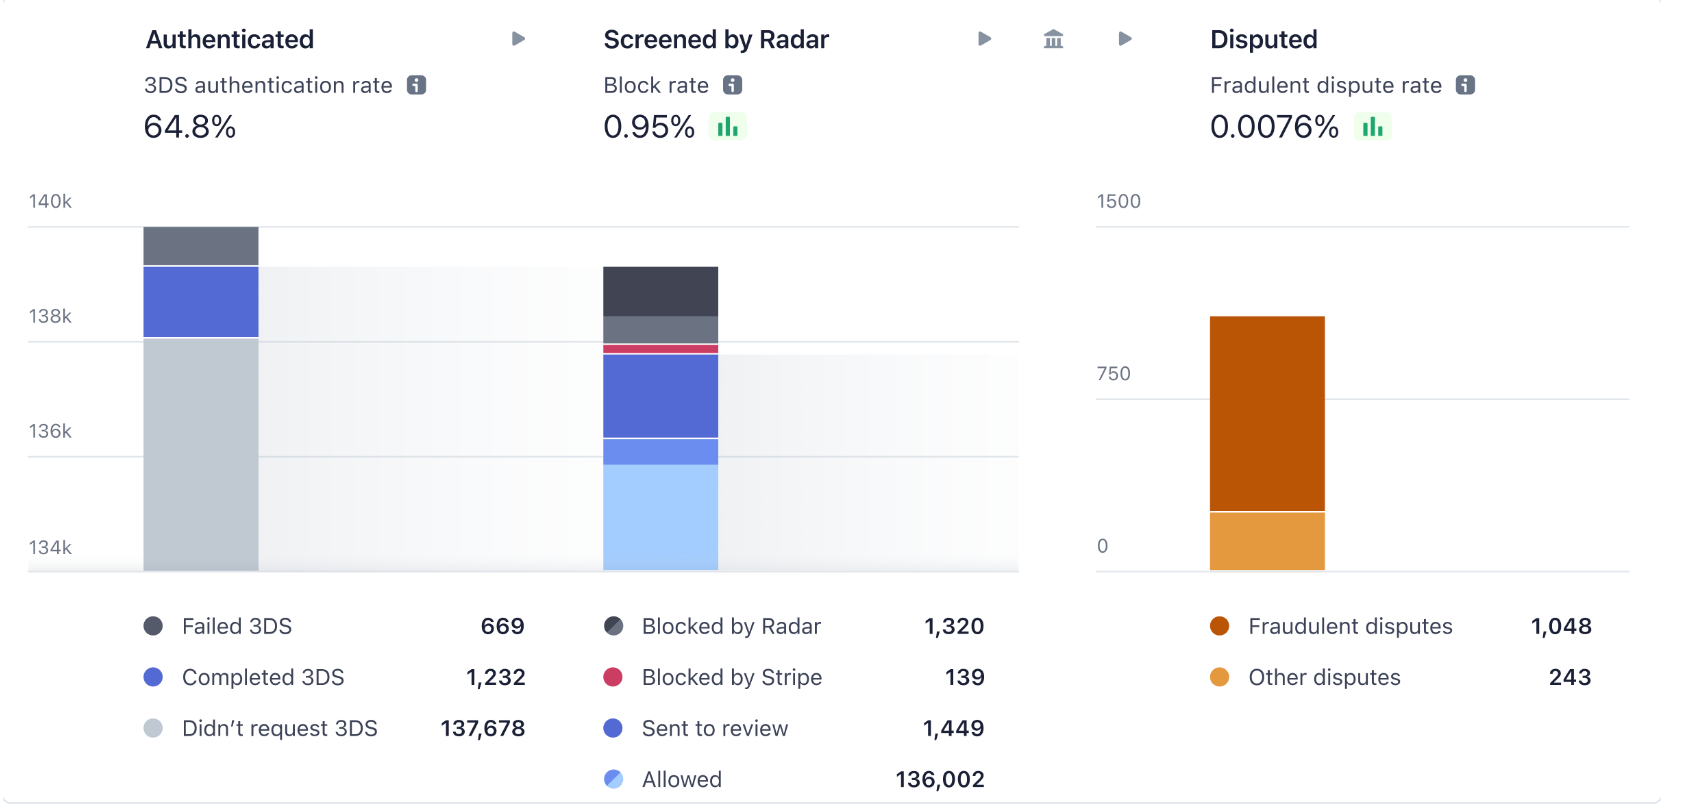
กฎเริ่มต้นของ Stripe ใช้แมชชีนเลิร์นนิงเพื่อคาดการณ์ ตรวจจับ และบล็อกการชำระเงินที่เป็นการฉ้อโกงจำนวนมาก แดชบอร์ดการวิเคราะห์ของ Radar สามารถให้ภาพรวมเกี่ยวกับแนวโน้มการฉ้อโกงได้อย่างรวดเร็ว และสำหรับธุรกิจที่ต้องการการควบคุมมากขึ้นว่าควรตรวจสอบ อนุญาต หรือบล็อกการชำระเงินใด กฎเหล่านี้จึงเป็นเครื่องมือที่มีประสิทธิภาพในการปรับแต่งระบบป้องกันการฉ้อโกงของคุณ

ก่อนที่คุณจะเริ่มตรวจจับรูปแบบการฉ้อโกงใหม่ๆ คุณต้องมีสัญญาณพื้นฐานเชิงคาดการณ์ก่อน เช่น ประสิทธิภาพของกฎเกณฑ์ที่มีอยู่ กล่าวอีกนัยหนึ่งคือ คุณต้องรู้ว่าอะไรที่ดู “ปกติ” สำหรับธุรกิจของคุณ หรือธุรกรรมที่ “ดี” มีลักษณะอย่างไร นั่นคือจุดที่นักวิเคราะห์การฉ้อโกงและวิศวกรข้อมูลของคุณทำงานร่วมกัน (พวกเขาอาจทำงานร่วมกับทีม DevOps และชุดโปรแกรมสังเกตการณ์ของพวกเขาด้วย) ในสถานการณ์จำลองสมมติของเรา การเพิ่มขึ้นของธุรกรรมที่ถูกปฏิเสธการชำระเงินจากประเภทบัตร “Mallory” จะถูกตรวจพบผ่านการตรวจสอบอย่างต่อเนื่อง
ตาราง Stripe Sigma ที่มีข้อมูลการฉ้อโกงที่เกี่ยวข้อง
ในการตรวจจับรูปแบบที่เกิดขึ้นใหม่ ขั้นแรก คุณต้องกำหนดประสิทธิภาพพื้นฐานด้วยฟีเจอร์ต่างๆ เช่น อัตราการปฏิเสธ/การอนุมัติของผู้ออกบัตร และอัตราการบล็อกของ Radar ขั้นต่อไป คุณจะต้องสืบค้นการโต้แย้งการชำระเงินที่เกี่ยวข้องกับการฉ้อโกง คำเตือนว่าอาจเป็นการฉ้อโกง (บันทึกการฉ้อโกงของผู้ออกบัตร) และธุรกรรมการชำระเงินที่มีความเร็วสูง การปฏิเสธของผู้ออกบัตรสูง หรือคะแนนความเสี่ยงของ Radar สูง ในทางที่ดี คุณควรกำหนดเวลาการสืบค้นทุกวันโดยอิงจากข้อมูลที่มีอยู่ และแสดงแดชบอร์ดทั้งหมดด้วยข้อมูลในอดีต รวมถึงการตัดเงินรายสัปดาห์และรายเดือน โดยไม่จำเป็นต้องสืบค้น Stripe Sigma หรือคลังข้อมูลของคุณด้วยตนเอง วิธีนี้จะช่วยเร่งเวลาในการตอบสนองต่อเหตุการณ์ของคุณ
ต่อไปนี้คือตารางที่เกี่ยวข้องมากที่สุด
|
ชื่อตาราง Stripe Sigma/Data Pipeline
|
คำอธิบาย
|
|---|---|
|
ออบเจ็กต์ Charge ใน Payments (การเรียกเก็บเงินดิบหลังจากตรวจสอบสิทธิ์ ไม่ใช่ Payment Intents)
|
|
|
การโต้แย้งการชำระเงินหรือการดึงเงินคืน รวมถึงรายการที่ทำเครื่องหมายว่าเป็น “การฉ้อโกง” (อาจมีคำเตือนว่าอาจเป็นการฉ้อโกงและการตรวจสอบเพิ่มเข้ามาด้วย)
|
|
|
บันทึกการฉ้อโกงของบริษัทผู้ออกบัตรที่ส่งโดยแผน (โปรดทราบว่าอาจไม่ได้มาล่วงหน้าเสมอไปและอาจไม่ได้เปลี่ยนเป็นการโต้แย้งการชำระเงินทุกครั้ง)
|
|
|
กฎ Radar จริงที่รวมไวยากรณ์ (โดยเฉพาะอย่างยิ่งกฎที่มีการตัดสิน)
|
|
| ออบเจ็กต์ Customer ซึ่งสำคัญสำหรับการลบรายการซ้ำและข้อมูลที่อยู่ (เช่น ชื่อและรหัสไปรษณีย์ของเจ้าของบัตร) | |
| ความพยายามตรวจสอบสิทธิ์เมื่อใช้ 3DS เพื่อเพิ่มขั้นตอน | |
| ติดตามการดำเนินการสุดท้ายที่ Radar ทำกับธุรกรรม | |
| (ใหม่) ติดตามค่ากฎจริงหลังจากการประเมินแต่ละธุรกรรม |
นักวิเคราะห์การฉ้อโกงหรือธุรกิจของคุณควรมีแนวคิดเกี่ยวกับมิติข้อมูลย่อยเพิ่มเติมที่อาจมีความสำคัญในการประเมินตามโดเมนธุรกิจของคุณ ตารางแอตทริบิวต์กฎ Radar ใน Radar for Fraud Teams จะมีข้อมูลโดยละเอียดสำหรับธุรกรรมที่มีอยู่ซึ่งได้รับการประเมินโดย Radar แต่จะไม่ย้อนกลับไปในประวัติก่อนเดือนเมษายน 2023 และไม่มีข้อมูลเมตาและผลลัพธ์สุดท้าย สำหรับข้อมูลก่อนหน้านี้ คุณจะต้องส่งการสืบค้นสำหรับช่องข้อมูลเหล่านี้
|
รายละเอียดมิติข้อมูล
|
ช่องในตารางแอตทริบิวต์กฎ Radar
|
ช่องในสกีมการเก็บถาวร
|
|---|---|---|
| แบรนด์ของบัตร การจัดหาเงินทุน หรือประเภทเครื่องมือการชำระเงิน | card_brand | |
| การใช้กระเป๋าเงินดิจิทัล | digital_wallet |
charges.card_tokenization_method
|
| ประเทศหรือภูมิภาคของบัตรหรือลูกค้า | card_country |
charges.card_country
|
| ลายนิ้วมือบัตร (สำหรับการใช้ซ้ำ) | card_fingerprint |
charges.card_fingerprint
|
| ยอดเงิน (ธุรกรรมเดียวหรือสะสม) | amount_in_usd |
charges.amount
|
| การตรวจสอบ CVC, ZIP (AVS) ต่อธุรกรรม | cvc_check address_zip_check | |
| ข้อมูลลูกค้าเกี่ยวกับการเรียกเก็บเงินและการจัดส่ง โดยเฉพาะรหัสไปรษณีย์และชื่อเจ้าของบัตร | shipping_address_postal_code billing_address_postal_code และช่องที่คล้ายกัน |
customer.address_postal_code และช่องที่คล้ายกัน
|
| กลุ่มผลิตภัณฑ์ | ไม่เกี่ยวข้อง | |
| คะแนนความเสี่ยง Radar | risk_score |
charges.outcome_risk_score
|
| ผลลัพธ์ของธุรกรรม | ไม่เกี่ยวข้อง |
charges.outcome_network_status
|
| เหตุผลในการปฏิเสธ | ไม่เกี่ยวข้อง |
charges.outcome_reason
|
| ลูกค้า (รายบุคคล แบบคลัสเตอร์ หรือแบ่งกลุ่ม เช่น อายุบัญชี ประเทศ หรือภูมิภาค แยกกันสำหรับการจัดส่งและการเรียกเก็บเงิน) | ลูกค้า |
payment_intents.customer_id
|
| บัญชีที่เชื่อมโยงสำหรับแพลตฟอร์ม (ทีละบัญชี แบบคลัสเตอร์ หรือแบ่งกลุ่ม เช่น อายุบัญชี ประเทศ หรือภูมิภาค) | ปลายทาง |
ตารางแอตทริบิวต์กฎ Radar ใหม่จะติดตามมิติข้อมูลเดียวกันและมิติอื่นๆ อีกมากมายสำหรับแต่ละธุรกรรมที่ Radar ประเมินด้วยชื่อแอตทริบิวต์ Radar ที่ถูกต้อง ตัวอย่างเช่น คุณสามารถติดตามแนวโน้มความเร็ว อย่างเช่น name_count_for_card_weekly
มีหลายวิธีในการแสดงภาพแนวโน้ม แต่แผนภูมิเส้น Pivot แบบง่ายๆ ต่อรายละเอียดย่อยเป็นวิธีที่ดีในการเปรียบเทียบกับปัจจัยอื่นๆ ได้อย่างง่ายดาย เมื่อเจาะลึกในขั้นตอนการตรวจสอบ คุณอาจต้องการรวมรายละเอียดย่อยต่างๆ เข้าด้วยกัน นี่คือตารางตัวอย่างที่แสดงรายละเอียดย่อยของกลุ่มผลิตภัณฑ์สำหรับการเพิ่มขึ้นของธุรกรรมที่ถูกปฏิเสธการชำระเงินจากบัตรประเภท "Mallory":
|
day_utc_iso
|
product_segment
|
charge_volume
|
dispute_percent_30d_rolling
|
raw_high_risk_percent
|
|---|---|---|---|---|
| 25/8/2022 | gift_cards | 521 | 0.05% | 0.22% |
| 25/8/2022 | อยู่กับที่ | 209 | 0.03% | 0.12% |
| 26/8/2022 | gift_cards | 768 | 0.04% | 0.34% |
| 26/8/2022 | อยู่กับที่ | 156 | 0.02% | 0.14% |
| 27/8/2022 | gift_cards | 5,701 | 0.12% | 0.62% |
| 27/8/2022 | อยู่กับที่ | 297 | 0.03% | 0.1% |
| 28/8/2022 | gift_cards | 6,153 | 0.25% | 0.84% |
| 28/8/2022 | อยู่กับที่ | 231 | 0.02% | 0.13% |
และคุณสามารถแสดงภาพดังกล่าวได้ในเครื่องมือสเปรดชีตที่คุณเลือก

ลองมาดูตัวอย่างการสืบค้น Stripe Sigma หรือ Data Pipeline เพื่อส่งคืนข้อมูลพื้นฐานกันโดยละเอียด ในการสืบค้นด้านล่าง คุณจะเห็นการโต้แย้งการชำระเงิน การปฏิเสธการชำระเงิน อัตราการบล็อก และอีกมากมายรายวันแยกกันเป็นคอลัมน์ ในระหว่างการตรวจจับและการตรวจสอบ การแสดงข้อมูลที่กว้างและมีข้อมูลบางตาในคอลัมน์แยกกันมักจะมองเห็นได้ง่ายกว่า นอกจากนี้ยังทำให้การจับคู่คอลัมน์เข้ากับข้อมูลของ Radar ง่ายขึ้นในภายหลัง แต่นักวิทยาศาสตร์ข้อมูลของคุณอาจต้องการข้อมูลในรูปแบบช่องที่สูงและมีข้อมูลหนาแน่นสำหรับการวิเคราะห์สำรวจระหว่างการตรวจสอบ หรือแมชชีนเลิร์นนิงในขั้นตอนการยืนยันและการปรับแต่งและการลดความเสี่ยง
ในตัวอย่างนี้ เราจะใส่ข้อมูลเมตาเกี่ยวกับการชำระเงินเพื่อแสดงรายละเอียดแยกตามกลุ่มผลิตภัณฑ์ ในภาพรวม เราจำเป็นต้องใช้การสืบค้นที่คล้ายกันสำหรับแบรนด์บัตร (“Mallory”) และประเภทเงินทุนตามสถานการณ์จำลองของเรา เราจะลดความซ้ำซ้อนของความพยายามในการลองใหม่ที่นี่เพื่อมุ่งเน้นไปที่ความตั้งใจจริงและรับรู้ความรู้สึกที่ชัดเจนยิ่งขึ้น เราเลือกที่จะลดความซ้ำซ้อนในความตั้งใจในการชำระเงิน การผสานการทำงานที่ลึกขึ้นอาจส่งช่องข้อมูล (เช่น ID คำสั่งซื้อในข้อมูลเมตา) เพื่อให้แน่ใจว่ามีการลดการซ้ำซ้อนตลอดเส้นทางของผู้ใช้ ตัวอย่างนี้แสดงให้เห็นว่าคุณสามารถเพิ่มความแม่นยำของมาตรการป้องกันการฉ้อโกงของคุณได้อย่างไรโดยการเพิ่มปัจจัยอื่น ในสถานการณ์จำลองของเรา นี่คือ "บัตรของขวัญ" ของกลุ่มผลิตภัณฑ์ เราจะกลับมาพูดถึงวิธีการเพิ่มความแม่นยำในส่วนของการปรับแต่งและการลดความเสี่ยงในภายหลัง
โปรดทราบว่าเราได้ปรับการสืบค้นที่ใช้ในคู่มือนี้ให้อ่านง่ายยิ่งขึ้น ตัวอย่างเช่น เราไม่ได้พิจารณาตัวบ่งชี้ที่เร็วหรือช้า เช่น ความล้มเหลวของ 3DS การโต้แย้งการชำระเงิน หรือระยะเวลาในการสร้างคำเตือนว่าอาจเป็นการฉ้อโกงแบบอิสระ นอกจากนี้ เรายังไม่รวมข้อมูลวงจรชีวิตลูกค้าและข้อมูลเมตาอื่นๆ เช่น ชื่อเสียงหรือคะแนนความเสี่ยง ตลอดทั้งขั้นตอนการเปลี่ยนเป็นผู้ใช้แบบชำระเงิน โปรดทราบว่าความสดใหม่ของข้อมูลใน Stripe Sigma และ Data Pipeline จะไม่แสดงการชำระเงินแบบเรียลไทม์
การสืบค้นนี้ไม่รวมเวลาในการโต้แย้งการชำระเงินจริง ซึ่งเป็นตัวบ่งชี้ที่ล่าช้า แต่เราได้รวมตัวอย่างตัวบ่งชี้บางส่วน เช่น การลองซ้ำที่เป็นตัวบ่งชี้ของการการทดสอบบัตร การสืบค้นนี้จะให้เมตริกรายวันโดยใช้วิธีง่ายๆ ดังนี้
- ปริมาณการเรียกเก็บเงิน ทั้งแบบยกเว้นรายการซ้ำและมูลค่าจริง: ตัวอย่างเช่น การเรียกเก็บเงิน 1,150 รายการต่อวัน ซึ่งมี 100 รายการถูกปฏิเสธและ 50 รายการถูกบล็อกโดย Radar สำหรับ 1,000 ความตั้งใจในการชำระเงิน
- อัตราการอนุมัติ: ในตัวอย่างนี้ คือ 90% สำหรับการเรียกเก็บเงิน เนื่องจากการชำระเงินที่ถูกบล็อกไม่ได้ไปถึงบริษัทผู้ออกบัตร และ 100% สำหรับความตั้งใจในการชำระเงินเนื่องจากทั้งหมดดำเนินการอีกครั้งได้สำเร็จ
- อัตราความเสี่ยงสูงและอัตราการบล็อก: ในกรณีนี้ทั้งสองอัตราจะอยู่ที่ 1.6% (ความเสี่ยงสูงทั้ง 50 รายการก็ถูกบล็อกเช่นกัน)
- อัตราการโต้แย้งการชำระเงินย้อนหลังสำหรับการชำระเงินในช่วงเวลาเดียวกัน ตัวอย่างเช่น การโต้แย้งการชำระเงิน 5 รายการใน 1,000 รายการ จำนวนเงินต่อวันของการชำระเงินจะเพิ่มขึ้นเมื่อมีการโต้แย้งการชำระเงินมากขึ้น ดังนั้น เราจึงรวมเวลาในการดำเนินการของการสืบค้นเพื่อติดตามการเปลี่ยนแปลง
ดังที่ได้กล่าวไว้ก่อนหน้านี้ เราได้ปรับการสืบค้นเหล่านี้ให้เรียบง่ายขึ้นเพื่อให้อ่านง่ายขึ้น การสืบค้นนี้จะมีมิติข้อมูลมากขึ้น เช่น แนวโน้ม ความเบี่ยงเบน หรือส่วนต่างของการสูญเสีย
นอกจากนี้เรายังได้รวมตัวอย่างค่าเฉลี่ยเคลื่อนที่ 30 วันโดยใช้ฟังก์ชันหน้าต่างไว้ด้วย ส่วนวิธีการที่ซับซ้อนกว่า เช่น การดูเปอร์เซ็นไทล์แทนค่าเฉลี่ยเพื่อระบุการโจมตีที่เฉพาะเจาะจงนั้นสามารถทำได้ แต่ไม่ค่อยจำเป็นสำหรับการตรวจจับการฉ้อโกงเบื้องต้น เนื่องจากเส้นแนวโน้มมีความสำคัญมากกว่าตัวเลขที่แม่นยำสมบูรณ์แบบ
เมื่อคุณเข้าใจข้อมูลเบื้องต้นแล้ว คุณสามารถเริ่มติดตามความผิดปกติและแนวโน้มต่างๆ เพื่อตรวจสอบ เช่น การฉ้อโกงหรืออัตราการบล็อกที่เพิ่มขึ้นจากบางประเทศหรือวิธีการชำระเงิน (ในสถานการณ์จำลองสมมติของเรา จะเป็นแบรนด์บัตร "Mallory") โดยทั่วไปแล้วจะมีการตรวจสอบความผิดปกติโดยใช้รายงานหรือการวิเคราะห์ด้วยตนเองในแดชบอร์ด หรือการสืบค้นเฉพาะกิจใน Stripe Sigma
การตรวจสอบ
เมื่อนักวิเคราะห์ของคุณพบความผิดปกติที่ต้องตรวจสอบ ขั้นตอนต่อไปคือการสืบค้นใน Stripe Sigma (หรือคลังข้อมูลของคุณผ่าน Data Pipeline) เพื่อสำรวจข้อมูลและสร้างสมมติฐาน คุณจะต้องระบุมิติข้อมูลย่อยตามสมมติฐานของคุณ เช่น วิธีการชำระเงิน (การใช้บัตร), ช่องทางหรือระบบ (ข้อมูลเมตา), ลูกค้า (ชื่อเสียง) หรือผลิตภัณฑ์ (ประเภทความเสี่ยง) ที่มีแนวโน้มจะเกิดการฉ้อโกง ในขั้นตอนการยืนยันในภายหลัง คุณอาจเรียกมิติข้อมูลเหล่านั้นว่า "คุณสมบัติ" โดยสิ่งต่างๆ เหล่านี้จะถูกจับคู่ในฐานของ Radar
เรากลับไปสู่สมมติฐานของเราว่าธุรกรรมจำนวนมากบนบัตรเติมเงินของ "Mallory" มีอัตราการฉ้อโกงที่สูงขึ้น ซึ่งคุณสามารถแสดงเป็นมิติการจัดกลุ่มเพื่อนำไปใช้เป็นเครื่องมือวิเคราะห์ได้ โดยทั่วไปในขั้นตอนนี้ การสืบค้นจะถูกทำซ้ำและปรับแต่ง ดังนั้นจึงควรรวมตัวเลือกเบื้องต้นเป็นเวอร์ชันที่ลดลงหรือขยายขึ้นของสมมติฐาน โดยการลบฟีเจอร์ย่อยเพื่อวัดผลกระทบของการสืบค้น ตัวอย่างเช่น
|
is_rule_1a_candidate1
|
s_rule_1a_candidate1_crosscheck
|
is_rule_1a_candidate2
|
is_rule_1a_candidate3
|
event_date
|
count_total_charges
|
|---|---|---|---|---|---|
| True | False | True | True | ก่อน | 506 |
| False | False | True | False | ก่อน | 1,825 |
| True | False | True | True | หลัง | 8,401 |
| False | False | True | False | หลัง | 1,493 |
วิธีนี้จะช่วยให้คุณเห็นภาพถึงขนาดของการจัดลำดับความสำคัญของผลกระทบ ตารางจะบอกคุณว่ากฎเกณฑ์ที่ 3 ดูเหมือนว่าจะสามารถตรวจจับธุรกรรมที่ประสงค์ร้ายมากเกินไปได้ด้วยความมั่นใจอย่างมีเหตุผล การประเมินที่ซับซ้อนยิ่งขึ้นจะพิจารณาจากความถูกต้อง ความแม่นยำ หรือรายการที่ตรวจจับได้ คุณสามารถสร้างผลลัพธ์แบบนี้ได้ด้วยการสืบค้นด้านล่าง
ในการสืบค้นนี้ เราได้ลบข้อมูลซ้ำซ้อนออกเพื่อให้อ่านง่ายขึ้น แต่ได้รวมอัตราโต้แย้งการชำระเงินและอัตราคำเตือนว่าอาจเป็นการฉ้อโกง ซึ่งมีความสำคัญต่อโปรแกรมการตรวจสอบแบรนด์ของบัตร อย่างไรก็ตาม นี่เป็นตัวบ่งชี้ที่ล่าช้า และในการสืบค้นแบบง่ายนี้ เราจะติดตามข้อมูลเหล่านี้โดยดูย้อนหลังเท่านั้น นอกจากนี้ เรายังได้รวมตัวอย่างการชำระเงินที่ไม่สมเหตุสมผลสำหรับการตรวจสอบย้อนกลับและการตรวจสอบรูปแบบที่พบในการสืบค้นโดยละเอียดยิ่งขึ้น โดยเราจะอธิบายเพิ่มเติมในภายหลัง
คุณอาจต้องการแยกเมตริกเพิ่มเติมออกเป็นฮิสโตแกรมเพื่อระบุคลัสเตอร์ ซึ่งอาจเป็นประโยชน์ต่อการกำหนดกฎความเร็วที่คุณสามารถใช้สำหรับขีดจำกัดอัตราได้ (เช่น total_charges_per customer_hourly)
การระบุแนวโน้มผ่านการวิเคราะห์ฮิสโทแกรมเป็นวิธีที่ยอดเยี่ยมในการทำความเข้าใจพฤติกรรมลูกค้าที่คุณต้องการตลอดวงจรชีวิตและขั้นตอนการเปลี่ยนเป็นผู้ใช้แบบชำระเงิน การเพิ่มฮิสโทแกรมลงในการสืบค้นข้างต้นอาจซับซ้อนเกินไป แต่นี่คือตัวอย่างง่ายๆ ในการแยกย่อยข้อมูลนี้โดยไม่ต้องใช้ตรรกะหน้าต่างหมุนเวียนที่ซับซ้อน โดยสมมติว่าคุณมีประเภทลูกค้าในข้อมูลเมตา (เช่น ผู้ใช้ที่ไม่ได้เข้าสู่ระบบ)
ในสถานการณ์จำลองของเรา คุณอาจไม่ต้องการบล็อกบัตรเติมเงินทั้งหมดจาก "Mallory" แต่ยังคงต้องการระบุปัจจัยเสี่ยงอื่นๆ ที่เกี่ยวข้องได้อย่างมั่นใจ การสืบค้นด้านความเร็วนี้อาจช่วยเพิ่มความมั่นใจ เช่น การหลีกเลี่ยงการบล็อกลูกค้าที่ใช้บริการน้อย
วิธีง่ายๆ ในการตรวจสอบคือการดูตัวอย่างโดยตรงในแดชบอร์ดผ่านมุมมอง "การชำระเงินที่เกี่ยวข้อง" เพื่อทำความเข้าใจพฤติกรรม นั่นคือ เวกเตอร์การโจมตีหรือรูปแบบการฉ้อโกง และข้อมูลเชิงลึกเกี่ยวกับความเสี่ยงของ Radar ที่เกี่ยวข้อง นั่นเป็นเหตุผลที่เราได้รวมตัวอย่างการชำระเงินที่ไม่สมเหตุสมผลไว้ในการสืบค้นด้านบน วิธีนี้จะช่วยให้คุณค้นหาการชำระเงินล่าสุดที่ยังไม่มีใน Stripe Sigma ได้อีกด้วย อีกวิธีหนึ่งที่เป็นการป้องกันและเข้มงวดมากขึ้นคือการจำลองสมมติฐานของคุณเป็นไม่สมเหตุสมผลกฎการตรวจสอบที่ยังคงอนุญาตให้ทำการชำระเงินได้ แต่จะส่งต่อไปให้นักวิเคราะห์ของคุณตรวจสอบด้วยตนเอง ลูกค้าบางรายทำเช่นนั้นเพื่อพิจารณาคืนเงินที่ชำระน้อยกว่าค่าธรรมเนียมการโต้แย้งการชำระเงิน ในขณะที่ทำการบล็อกค่าธรรมเนียมข้างต้น
การยืนยัน
ต่อไป สมมติว่ารูปแบบที่คุณระบุไว้ไม่ง่าย ไม่สามารถบรรเทาได้ด้วยการคืนเงินและบล็อกลูกค้าที่ฉ้อโกง และไม่ได้อยู่ในรายการบล็อกเริ่มต้น
หลังจากระบุและจัดลำดับความสำคัญของรูปแบบใหม่ที่ต้องจัดการแล้ว คุณจำเป็นต้องวิเคราะห์ผลกระทบที่อาจเกิดขึ้นต่อรายรับที่ถูกต้องตามกฎหมายของคุณ นี่ไม่ใช่ปัญหาการหาค่าเหมาะที่สุด เพราะปริมาณการฉ้อโกงที่เหมาะสมที่สุดนั้นไม่ใช่ศูนย์ จากตัวเลือกแบบจำลองทั้งหมด ให้เลือกแบบจำลองที่แสดงถึงการแลกเปลี่ยนที่ดีที่สุดกับความเสี่ยงที่คุณยอมรับได้ ไม่ว่าจะเป็นขนาดหรือความแม่นยำ รวมถึงรายการที่ตรวจจับได้ กระบวนการนี้บางครั้งเรียกว่าการทดสอบย้อนหลัง โดยเฉพาะอย่างยิ่งเมื่อมีการเขียนกฎก่อน แล้วจึงตรวจสอบความถูกต้องกับข้อมูลของคุณ (คุณยังสามารถทำแบบย้อนกลับได้ นั่นคือ ค้นพบรูปแบบก่อนแล้วจึงเขียนกฎ) ยกตัวอย่างเช่น แทนที่จะเขียนกฎหนึ่งข้อต่อประเทศ ให้เขียนกฎแบบนี้ที่ทำให้การยืนยันง่ายขึ้น
Block if :card_funding: = 'prepaid and :card_country: in @preaid_card_countries_to_block
การสืบค้นที่แชร์ข้างต้นในส่วนการตรวจสอบอาจใช้เป็นโมเดลได้เช่นกัน ยกเว้นว่าจะมีการเน้นค่าที่แตกต่างกัน ซึ่งเราจะพูดถึงเรื่องนี้เพิ่มเติมในภายหลังเมื่อเราพูดถึงเทคนิคการปรับแต่งและการบรรเทาความเสี่ยง
สคีมา Stripe Sigma กับการจับคู่กฎ Radar
ได้เวลาแปลการสืบค้นเชิงสำรวจของคุณจาก Stripe Sigma หรือ Data Pipeline เพื่อช่วยคุณในการจับคู่กฎ Radar กับ Stripe Sigma สำหรับการทดสอบย้อนหลัง ต่อไปนี้คือการจับคู่ที่พบบ่อยบางส่วน โดยสมมติว่าคุณกำลังส่งสัญญาณที่ถูกต้องไปยัง Radar
|
ชื่อกฎ Radar
|
ตารางและคอลัมน์ Stripe Sigma
|
|---|---|
| address_zip_check |
charges.card_address_zip_check
|
| amount_in_xyz | |
| average_usd_amount_attempted_on_customer_* | |
| billing_address_country |
charges.card_address_country
|
| card_brand |
charges.card_brand
|
| card_country |
charges.card_country
|
| card_fingerprint |
charges.card_fingerprint
|
| card_funding |
charges.card_funding
|
| customer_id |
Payment intents.customer_id
|
| card_count_for_customer_* |
Payment intents.customer_id และ charges.card_fingerprint
|
| cvc_check |
charges.card_cvc_check
|
| declined_charges_per_card_number_* | |
| declined_charges_per_*_address_* | |
| destination |
charges.destination_id สำหรับแพลตฟอร์ม Connect
|
| digital_wallet |
charges.card_tokenization_method
|
| dispute_count_on_card_number_* | |
| efw_count_on_card_* |
early fraud warning และ charges.card_fingerprint
|
| is_3d_secure |
payment method details.card_3ds_authenticated
|
| is_3d_secure_authenticated |
payment method details.card_3ds_succeeded
|
| is_off_session |
Payment intents.setup_future_usage
|
| risk_score |
charges.outcome_risk_score
|
| risk_level |
charges.outcome_risk_level
|
ทั้งสองรายการสุดท้าย risk_level และ risk_score ไม่เหมือนกับรายการอื่นๆ เนื่องจากโมเดลแมชชีนเลิร์นนิงเองมาจากปัจจัยอื่น แทนที่จะเขียนกฎที่ซับซ้อนเกินไป เราขอแนะนำให้คุณใช้แมชชีนเลิร์นนิงของ Radar โดยเราจะพูดถึงเรื่องนี้เพิ่มเติมในส่วนการปรับแต่งโดยใช้แมชชีนเลิร์นนิง
ตารางแอตทริบิวต์กฎ Radar ใหม่จะติดตามมิติเดียวกันและมากขึ้นสำหรับธุรกรรมแต่ละรายการที่ประเมินแล้วโดย Radar โดยใช้ชื่อที่แน่นอนของแอตทริบิวต์ Radar
ตารางข้างต้นแสดงชุดแอตทริบิวต์มาตรฐานและละเว้นสัญญาณที่คุณจะปรับแต่งตามเส้นทางของลูกค้า เช่น Radar Sessions หรือ metadata
จากการตรวจสอบข้างต้น สมมติว่าคุณได้กฎที่มีลักษณะดังนี้:
Block if :card_funding: = 'prepaid' and :card_funding: = 'mallory' and :amount_in_usd: > 20 and ::CustomerType:: = 'guest' and :total_charges_per_customer_hourly: > 2
ขั้นตอนต่อไปคือการยืนยันผลกระทบของกฎนี้ต่อธุรกรรมการชำระเงินที่เกิดขึ้นจริง โดยทั่วไปแล้วคุณจะทำเช่นนี้โดยใช้กฎการบล็อก ให้อ่านคู่มือ Radar for Fraud Teams: Rules 101 ของเราเพื่อดูคำแนะนำเกี่ยวกับวิธีเขียนไวยากรณ์กฎที่ถูกต้อง วิธีง่ายๆ ในการทดสอบกฎการบล็อกคือการสร้างกฎในโหมดทดสอบและสร้างการชำระเงินสำหรับการทดสอบด้วยตนเองเพื่อตรวจสอบว่ากฎทำงานได้ตามที่กำหนดไว้
ทั้งกฎการบล็อกและกฎการตรวจสอบสามารถทดสอบย้อนหลังได้ใน Radar โดยใช้ฟีเจอร์การจำลอง Radar for Fraud Teams .
ข้อดีอย่างหนึ่งของการใช้ Radar for Fraud Teams ในการจำลองสถานการณ์คือการพิจารณาผลกระทบของกฎอื่นๆ ที่มีอยู่ การดูแลกฎไม่ใช่ประเด็นหลักของคู่มือนี้ แต่การลบและการอัปเดตกฎก็ควรเป็นส่วนหนึ่งของกระบวนการพัฒนาอย่างต่อเนื่องของคุณเช่นกัน โดยทั่วไปแล้ว จำนวนกฎที่คุณมีควรมีขนาดเล็กพอที่แต่ละกฎจะมีขนาดเล็กๆ และสามารถตรวจสอบได้โดยใช้การสืบค้นพื้นฐานที่พัฒนาขึ้นในขั้นตอนการตรวจจับและการตรวจสอบ และสามารถทดสอบย้อนหลังได้อย่างชัดเจน โดยไม่มีความเสี่ยงข้างเคียงต่างๆ (เช่น กฎข้อที่ 2 จะใช้งานได้ก็ต่อเมื่อกฎข้อที่ 1 กรองกฎอื่นๆ ออก)
คุณยังสามารถทำได้โดยใช้กฎการตรวจสอบแทนกฎการบล็อก ซึ่งเราจะอธิบายในส่วนถัดไป
การปรับแต่งและการลดความเสี่ยง
สุดท้าย หลังจากทดสอบกฎการบล็อกแล้ว คุณจะใช้โมเดลนี้เพื่อป้องกัน ตรวจสอบ หรือเปลี่ยนเส้นทางการฉ้อโกง เราเรียกสิ่งนี้ว่าการปรับแต่ง เพราะเป็นการเพิ่มความแม่นยำของมาตรการป้องกันการฉ้อโกงโดยรวม โดยเฉพาะอย่างยิ่งเมื่อใช้ร่วมกับแมชชีนเลิร์นนิง ในการเพิ่มความแม่นยำ คุณอาจนำเทคนิคต่างๆ มาใช้ ซึ่งบางครั้งขั้นตอนนี้อาจเรียกว่าการควบคุม หรือการลดความเสี่ยง ที่จะเกิดขึ้นพร้อมกับการยืนยัน ซึ่งแทนที่จะใช้กฎการตรวจสอบ การทดสอบ A/B (ข้อมูลเมตา) หรือการจำลองสถานการณ์เพื่อประเมินโมเดลของคุณ คุณจะบล็อกการเรียกเก็บเงินที่น่าสงสัยทันทีเพื่อลดความเสี่ยงที่เกิดขึ้นโดยทันที
แม้ว่าคุณจะได้ดำเนินการไปแล้ว แต่ก็ยังมีเทคนิคบางอย่างที่คุณสามารถใช้ปรับแต่งโมเดลที่คุณพัฒนาขึ้นในขั้นตอนที่ 1-3 เพื่อปรับปรุงผลลัพธ์ในระยะยาว
การปรับแต่งโดยใช้กฎการตรวจสอบ
หากคุณไม่ต้องการเสี่ยงต่ออัตราการตรวจพบที่ผิดพลาดที่สูงขึ้น ซึ่งอาจส่งผลกระทบต่อรายรับของคุณ คุณสามารถเลือกใช้กฎการตรวจสอบได้ แม้ว่าการดำเนินการนี้จะดำเนินการด้วยตนเองและอาจเพิ่มปัญหาให้กับประสบการณ์ของลูกค้า แต่กฎการตรวจสอบสามารถช่วยให้ธุรกรรมที่ถูกต้องตามกฎหมายสามารถดำเนินต่อไปได้ในที่สุด (คุณยังสามารถเพิ่มการควบคุมปริมาณธุรกรรมในรูปแบบของกฎความเร็วลงในกฎการบล็อกที่มีอยู่สำหรับธุรกรรมที่มีความเร็วช้ากว่าได้) ตัวเลือกขั้นสูงกว่าสำหรับการใช้กฎการตรวจสอบคือการทดสอบ A/B ซึ่งมีประโยชน์อย่างยิ่งในการจัดการจำนวนเคสทั้งหมดในคิวการตรวจสอบ คุณสามารถใช้ประโยชน์จากข้อมูลเมตาจากการชำระเงินของคุณเพื่อเริ่มอนุญาตให้มีปริมาณการใช้งานเล็กน้อยในระหว่างการทดสอบ A/B เช่น จากลูกค้าที่รู้จัก หรือเพียงแค่ใช้ตัวเลขสุ่ม เราขอแนะนำให้เพิ่มสิ่งนี้ลงในกฎการบล็อกแทนที่จะสร้างกฎการอนุญาต เนื่องจากกฎการอนุญาตจะแทนที่การบล็อก และทำให้การติดตามประสิทธิภาพของกฎการบล็อกในช่วงเวลาหนึ่งทำได้ยากขึ้น
การเพิ่มประสิทธิภาพกฎโดยการติดตามตรวจสอบประสิทธิภาพ
ในการตรวจสอบประสิทธิภาพของกฎ คุณสามารถตรวจสอบออบเจ็กต์การเรียกเก็บเงินได้ใน Payment Intents API โดยเฉพาะอย่างยิ่งออบเจ็กต์ของกฎใน Stripe Sigma คุณสามารถใช้ช่องข้อมูล charges.outcome_rule_id, charges.outcome_type และ payment_intents.review_id เพื่อทำการวิเคราะห์ได้ นี่คือตัวอย่างวิธีการติดตามประสิทธิภาพของกฎใน Stripe Sigma โดยใช้ตารางการตัดสินใจกฎ Radar พิเศษ:
การปรับแต่งโดยใช้แมชชีนเลิร์นนิง
ขั้นตอนต่อไปหลังจากบล็อกการโจมตีทันทีมักจะเป็นการปรับแต่งกฎพร้อมกับแมชชีนเลิร์นนิงเพื่อลดการตรวจพบที่ผิดพลาด เพื่อให้มีปริมาณการใช้งานที่ถูกต้องมากขึ้น ดังนั้นจึงสามารถสร้างรายรับได้
ตัวอย่างเช่น การบล็อก BIN หรือ IIN (หมายเลขประจำตัวของบริษัทผู้ออกบัตร) ระหว่างการโจมตีการทดสอบบัตร คุณอาจเพิ่ม BIN ไปยังรายการที่บล็อกชั่วคราว ซึ่งช่วยให้บริษัทผู้ออกบัตรมีเวลาแก้ไขช่องโหว่ของตน อย่างไรก็ตาม การบล็อกบริษัทผู้ออกบัตรโดยตรงอาจลดรายรับของคุณ แนะนำให้ใช้การตรวจสอบที่เข้มงวดมากขึ้นเมื่อเวลาผ่านไปและทำการปรับปรุงโมเดล นี่เป็นเวลาที่ดีที่จะทบทวนวิธีเขียนกฎที่ที่มีประสิทธิภาพ และวิธีประเมินความเสี่ยง โดยเฉพาะอย่างยิ่งการให้คะแนนความเสี่ยงของ Radar โดยทั่วไปเราขอแนะนำให้ใช้แมชชีนเลิร์นนิงของ Radar ร่วมกับสัญชาตญาณของคุณ แทนที่จะใช้กฎเพียงข้อเดียวเพื่อบล็อกธุรกรรมที่มีความเสี่ยงสูงทั้งหมด การรวมคะแนนกับกฎที่เขียนขึ้นเองจะทำให้เกิดโมเดลหรือสถานการณ์จำลองความเสี่ยงที่มักจะสร้างสมดุลที่ดีกว่าระหว่างการบล็อกการใช้งานที่เป็นอันตรายและการเปิดโอกาสให้เกิดรายรับ ตัวอย่างเช่น
Block if :card_funding: = 'prepaid' and :card_funding: = 'mallory' and :card_country: in @high_risk_card_countries_to_block and :risk_score: > 65 and :amount_in_usd: > 10
การปรับแต่งโดยใช้ 3DS
ดังที่กล่าวไปก่อนหน้านี้ แม้ว่าคู่มือนี้จะไม่ครอบคลุมถึงขอบเขตของการตรวจสอบสิทธิ์แบบ 3D Secure (3DS) แต่คุณควรพิจารณาว่าการดำเนินการนี้เป็นส่วนหนึ่งของกลยุทธ์การลดความเสี่ยงของคุณ ตัวอย่างเช่น แม้ว่าการโอนความรับผิดจะช่วยลดค่าธรรมเนียมการโต้แย้งการชำระเงินสำหรับธุรกรรมที่เป็นการฉ้อโกงได้ แต่ธุรกรรมเหล่านี้ก็ยังคงถูกนับรวมอยู่ในโปรแกรมการตรวจสอบบัตร และส่งผลต่อประสบการณ์การใช้งานของคุณ โดยแทนที่จะกำหนดจำนวนเงินคงที่ คุณสามารถปรับกฎนี้จาก "บล็อกการเรียกเก็บเงินที่เกี่ยวข้องทั้งหมด" เป็น "คำขอ 3DS" ได้
Request 3DS if :card_country: in @high_risk_card_countries_to_block or :ip_country: in @high_risk_card_countries_to_block or :is_anonymous_ip: = ‘true’ or :is_disposable_email: = ‘true’
จากนั้นใช้กฎเพื่อบล็อกบัตรที่ยังไม่ได้ตรวจสอบสิทธิ์ได้สำเร็จหรือด้วยเหตุผลอื่นๆ ที่ทำให้ไม่สามารถโอนความรับผิดได้:
Block if (:card_country: in @high_risk_card_countries_to_block or :ip_country: in @high_risk_card_countries_to_block or :is_anonymous_ip: = ‘true’ or :is_disposable_email: = ‘true’) and :risk_score: > 65 and :has_liability_shift: != ‘true’
การปรับแต่งโดยใช้รายการ
การใช้รายการเริ่มต้นหรือการใช้รายการที่กำหนดเองอาจเป็นวิธีที่มีประสิทธิภาพมากในการบล็อกการโจมตีในระหว่างเหตุการณ์โดยไม่เสี่ยงต่อการเปลี่ยนแปลงกฎ เช่น การบล็อกลูกค้า โดเมนอีเมล หรือประเทศของบัตรที่เป็นการฉ้อโกง ส่วนหนึ่งของการปรับแต่งคือการตัดสินใจว่ารูปแบบใดควรเป็นกฎ รูปแบบใดควรเปลี่ยนเงื่อนไขของกฎ และรูปแบบใดที่สามารถเพิ่มมูลค่าให้กับรายการที่มีอยู่ได้ กฎการปลดล็อกเป็นตัวอย่างที่ดีในการแก้ปัญหาเฉพาะหน้าระหว่างเหตุการณ์ ซึ่งในภายหลังอาจสามารถปรับแต่งให้เป็นรายการหรือเปลี่ยนแปลงกฎที่มีอยู่ได้
ขั้นตอนการเสนอแนะ
การปรับแต่งยังหมายความว่าคุณต้องกลับไปในขั้นตอนที่ 1 ซึ่งก็คือการติดตามประสิทธิภาพของกฎและรูปแบบการฉ้อโกง การตรวจสอบที่ดีนั้นขึ้นอยู่กับเกณฑ์พื้นฐานที่กำหนดไว้ การเปลี่ยนแปลงเล็กๆ น้อยๆ เพื่อการตรวจสอบย้อนกลับ ความแม่นยำ และรายการที่ตรวจจับได้จากการทดสอบย้อนหลัง ด้วยเหตุนี้ เราจึงขอแนะนำให้เปลี่ยนแปลงกฎและมูลฐานเฉพาะในการใช้งานที่ชัดเจนและแยกจากกัน และในกรณีอื่นๆ ให้อาศัยรายการ การตรวจสอบ การบล็อกเชิงรุก และการคืนเงินแทน
Stripe ช่วยอะไรได้บ้าง
Radar สำหรับแพลตฟอร์ม
คุณเป็นแพลตฟอร์มที่ใช้ Stripe Connect หรือไม่ หากใช่ กฎใดๆ ที่คุณสร้างขึ้นจะมีผลกับการชำระเงินที่สร้างบนบัญชีแพลตฟอร์มเท่านั้น (ในข้อกำหนดของ Connect กฎเหล่านี้คือการเรียกเก็บเงินปลายทางหรือในนามของแพลตฟอร์ม
) การชำระเงินที่สร้างโดยตรงบนบัญชีที่เชื่อมโยงจะอยู่ภายใต้กฎของบัญชีนั้น
Radar สำหรับ Terminal
การเรียกเก็บเงินจาก Stripe Terminal จะไม่ถูกคัดกรองโดย Radar ซึ่งหมายความว่าหากคุณใช้ Terminal คุณสามารถกำหนดกฎเกณฑ์ตามความถี่ของ IP ได้โดยไม่ต้องกังวลเรื่องการบล็อกการชำระเงินที่จุดขาย
บริการเฉพาะทางของ Stripe
ทีมบริการเฉพาะทางของ Stripe พร้อมช่วยคุณปรับปรุงการจัดการการฉ้อโกงอย่างต่อเนื่อง ตั้งแต่การเสริมสร้างการผสานการทำงานปัจจุบันไปจนถึงการเปิดตัวโมเดลธุรกิจใหม่ๆ โดยผู้เชี่ยวชาญของเราจะให้คำแนะนำเพื่อช่วยคุณพัฒนาโซลูชัน Stripe ที่มีอยู่
บทสรุป
ในคู่มือนี้ เราได้อธิบายวิธีใช้ Stripe Sigma หรือ Data Pipeline เพื่อสร้างโมเดลการฉ้อโกงทั้งแบบพื้นฐาน รวมถึงโมเดลการฉ้อโกงต่างๆ ที่แสดงสถานการณ์และรูปแบบการโจมตีที่เฉพาะคุณและธุรกิจของคุณเท่านั้นที่สามารถตัดสินได้ นอกจากนี้เรายังได้แสดงให้เห็นว่าคุณสามารถขยายและปรับแต่ง Radar ให้สามารถตอบสนองต่อธุรกรรมฉ้อโกงที่หลากหลายยิ่งขึ้นตามกฎที่คุณกำหนดเองได้
เนื่องจากการฉ้อโกงด้านการชำระเงินมีการพัฒนาอย่างต่อเนื่อง กระบวนการนี้จึงต้องมีการพัฒนาอย่างต่อเนื่องเพื่อให้ทันต่อสถานการณ์ ดังที่เราได้อธิบายไว้ในโมเดลการตรวจจับ การตรวจสอบ การยืนยัน รวมถึงการปรับแต่งและการลดความเสี่ยง การดำเนินการตามวงจรเหล่านี้อย่างต่อเนื่องพร้อมวงจรป้อนกลับที่รวดเร็วจะช่วยให้คุณใช้เวลาน้อยลงในการรับมือกับเหตุการณ์ต่างๆ และมีเวลามากขึ้นในการพัฒนากลยุทธ์การฉ้อโกงเชิงรุก
ดูข้อมูลเพิ่มเติมเกี่ยวกับ Radar for Fraud Teams ได้ที่นี่ หากคุณเป็นผู้ใช้ Radar for Fraud Teams อยู่แล้ว ให้ดูหน้ากฎในแดชบอร์ดของคุณเพื่อเริ่มใช้งานด้วยการเขียนกฎ
ดูข้อมูลเพิ่มเติมเกี่ยวกับ Stripe Sigma ได้ที่นี่ และเกี่ยวกับ Stripe Data Pipeline ได้ที่นี่