The secret life of DNS packets: investigating complex networks
DNS is a critical piece of infrastructure used to facilitate communication across networks. It’s often described as a phonebook: in its most basic form, DNS provides a way to look up a host’s address by an easy-to-remember name. For example, looking up the domain name stripe.com will direct clients to the IP address 53.187.159.182, where one of Stripe’s servers is located. Before any communication can take place, one of the first things a host must do is query a DNS server for the address of the destination host. Since these lookups are a prerequisite for communication, maintaining a reliable DNS service is extremely important. DNS issues can quickly lead to crippling, widespread outages, and you could find yourself in a real bind.
It’s important to establish good observability practices for these systems so when things go wrong, you can clearly understand how they’re failing and act quickly to minimize any impact. Well-instrumented systems provide visibility into how they operate; establishing a monitoring system and gathering robust metrics are both essential to effectively respond to incidents. This is critical for post-incident analysis when you’re trying to understand the root cause and prevent recurrences in the future.
In this post, I’ll describe how we monitor our DNS systems and how we used an array of tools to investigate and fix an unexpected spike in DNS errors that we encountered recently.
DNS infrastructure at Stripe
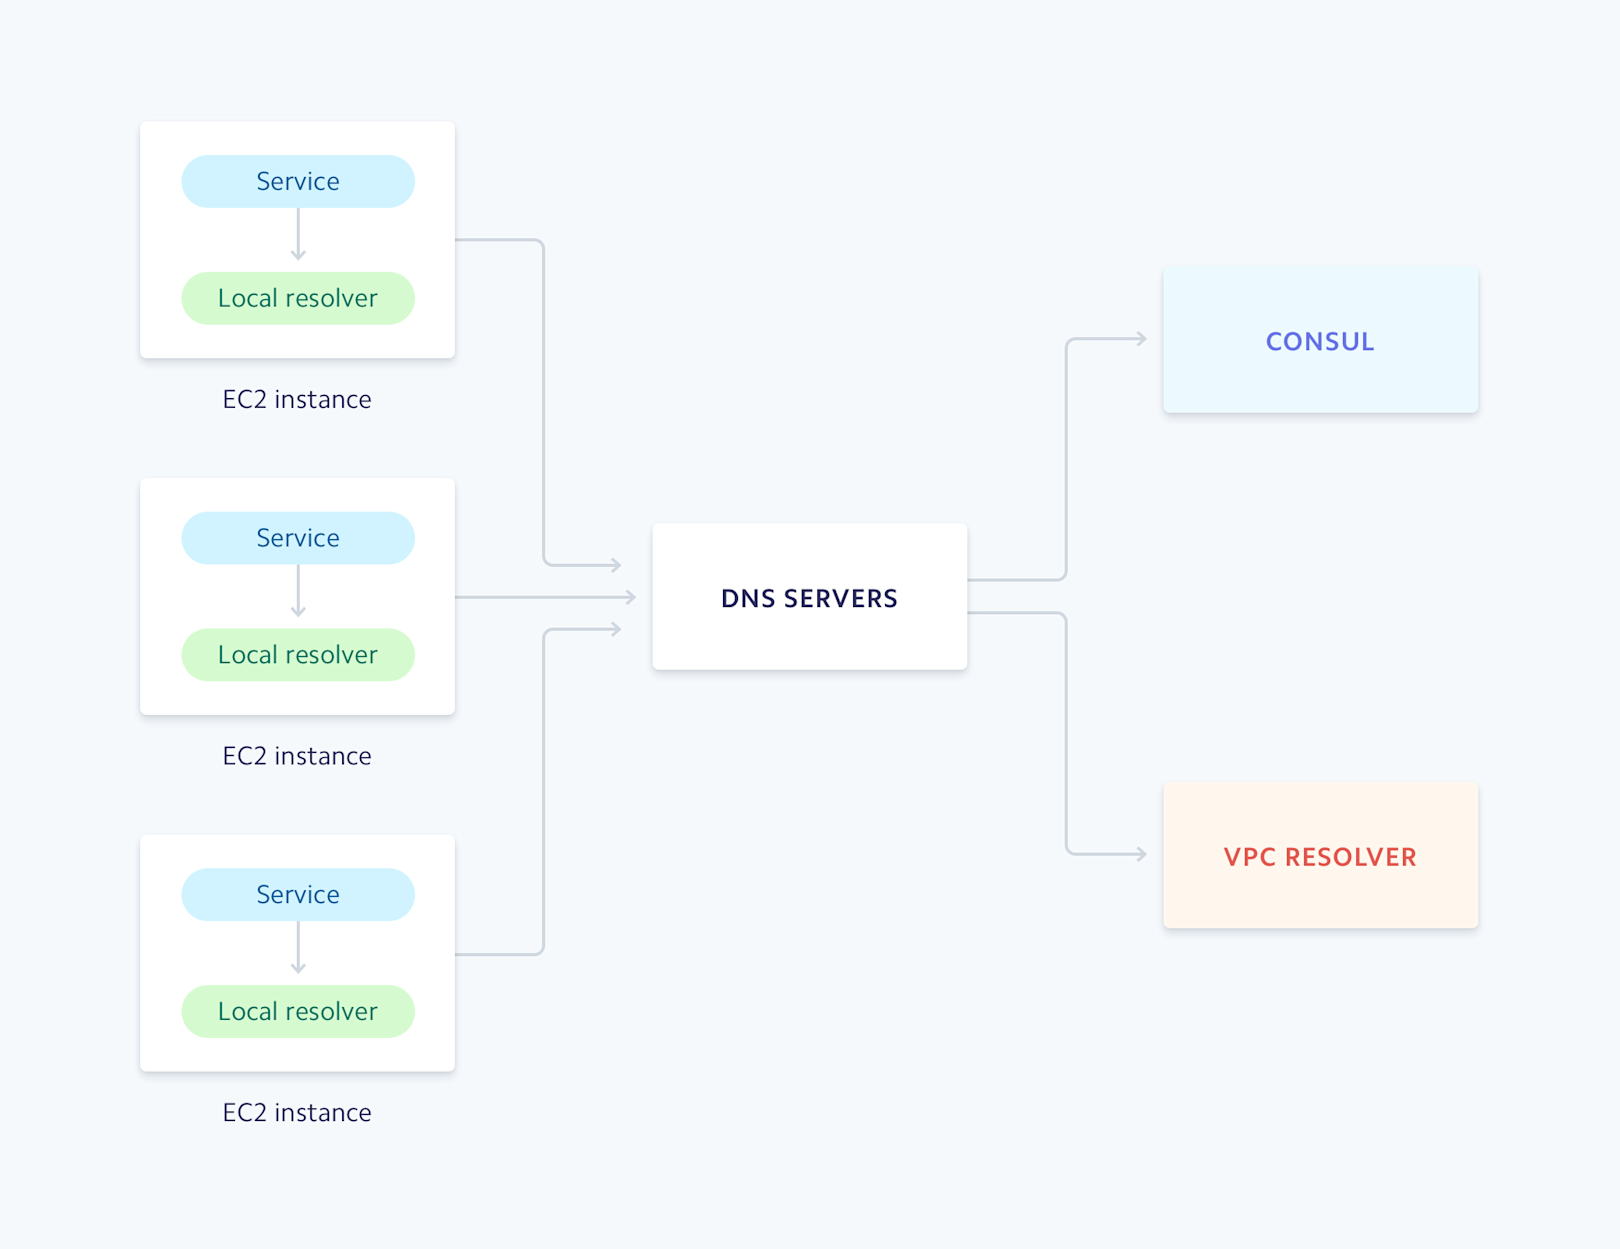
At Stripe, we operate a cluster of DNS servers running Unbound, a popular open-source DNS resolver that can recursively resolve DNS queries and cache the results. These resolvers are configured to forward DNS queries to different upstream destinations based on the domain in the request. Queries that are used for service discovery are forwarded to our Consul cluster. Queries for domains we configure in Route 53 and any other domains on the public Internet are forwarded to our cluster’s VPC resolver, which is a DNS resolver that AWS provides as part of their VPC offering. We also run resolvers locally on every host, which provides an additional layer of caching.

Unbound runs locally on every host as well as on the DNS servers.
Unbound exposes an extensive set of statistics that we collect and feed into our metrics pipeline. This provides us with visibility into metrics like how many queries are being served, the types of queries, and cache hit ratios.


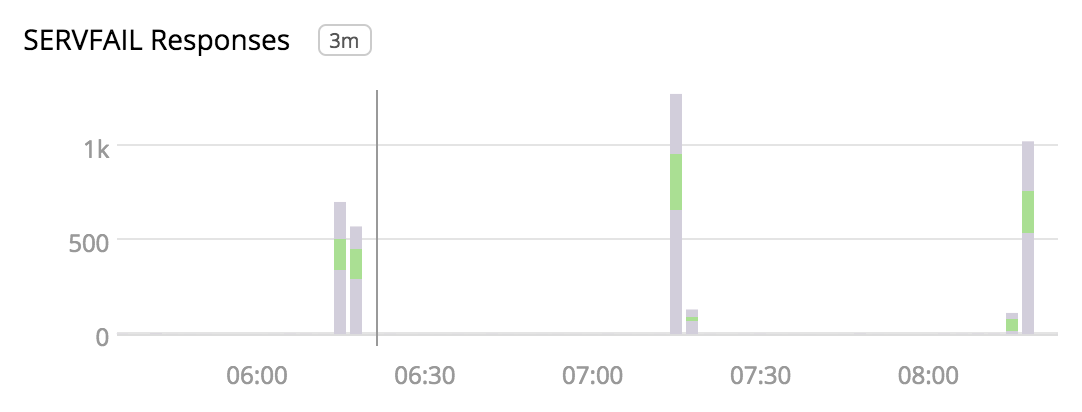
We recently observed that for several minutes every hour, the cluster’s DNS servers were returning SERVFAIL responses for a small percentage of internal requests. SERVFAIL is a generic response that DNS servers return when an error occurs, but it doesn’t tell us much about what caused the error.

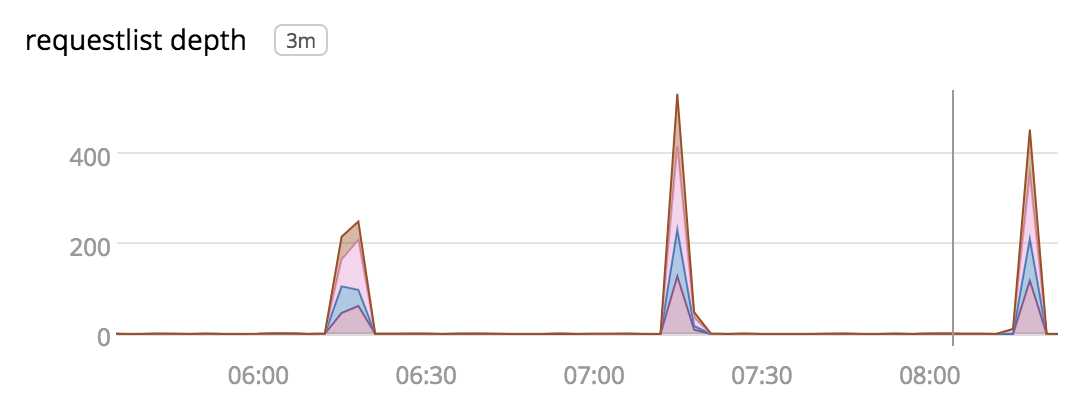
Without much to go on initially, we found another clue in the request list depth metric. (You can think of this as Unbound’s internal todo list, where it keeps track of all the DNS requests it needs to resolve.)

An increase in this metric indicates that Unbound is unable to process messages in a timely fashion, which may be caused by an increase in load. However, the metrics didn’t show a significant increase in the number of DNS queries, and resource consumption didn’t appear to be hitting any limits. Since Unbound resolves queries by contacting external nameservers, another explanation could be that these upstream servers were taking longer to respond.
Tracking down the source
We followed this lead by logging into one of the DNS servers and inspecting Unbound’s request list.
This confirmed that requests were accumulating in the request list. We noticed some interesting details: most of the entries in the list corresponded to reverse DNS lookups (PTR records) and they were all waiting for a response from 10.0.0.2, which is the IP address of the VPC resolver.
We then used tcpdump to capture the DNS traffic on one of the servers to get a better sense of what was happening and try to identify any patterns. We wanted to make sure we captured the traffic during one of these spikes, so we configured tcpdump to write data to files over a period of time. We split the files across 60 second collection intervals to keep file sizes small, which made it easier to work with them.
The packet captures revealed that during the hourly spike, 90% of requests made to the VPC resolver were reverse DNS queries for IPs in the 104.16.0.0/12 CIDR range. The vast majority of these queries failed with a SERVFAIL response. We used dig to query the VPC resolver with a few of these addresses and confirmed that it took longer to receive responses.
By looking at the source IPs of clients making the reverse DNS queries, we noticed they were all coming from hosts in our Hadoop cluster. We maintain a database of when Hadoop jobs start and finish, so we were able to correlate these times to the hourly spikes. We finally narrowed down the source of the traffic to one job that analyzes network activity logs and performs a reverse DNS lookup on the IP addresses found in those logs.
One more surprising detail we discovered in the tcpdump data was that the VPC resolver was not sending back responses to many of the queries. During one of the 60-second collection periods the DNS server sent 257,430 packets to the VPC resolver. The VPC resolver replied back with only 61,385 packets, which averages to 1,023 packets per second. We realized we may be hitting the AWS limit for how much traffic can be sent to a VPC resolver, which is 1,024 packets per second per interface. Our next step was to establish better visibility in our cluster to validate our hypothesis.
Counting packets
AWS exposes its VPC resolver through a static IP address relative to the base IP of the VPC, plus two (for example, if the base IP is 10.0.0.0, then the VPC resolver will be at 10.0.0.2). We need to track the number of packets sent per second to this IP address. One tool that can help us here is iptables, since it keeps track of the number of packets matched by a rule.
We created a rule that matches traffic headed to the VPC resolver IP address and added it to the OUTPUT chain, which is a set of iptables rules that are applied to all packets sent from the host.
We configured the rule to jump to a new chain called VPC_RESOLVER and added an empty rule to that chain. Since our hosts could contain other rules in the OUTPUT chain, we added this rule to isolate matches and make it a little easier to parse the output.
Listing the rules, we see the number of packets sent to the VPC resolver in the output:
With this, we wrote a simple service that reads the statistics from the VPC_RESOLVER chain and reports this value through our metrics pipeline.
Once we started collecting this metric, we could see that the hourly spikes in SERVFAIL responses lined up with periods where the servers were sending too much traffic to the VPC resolver.

Traffic amplification
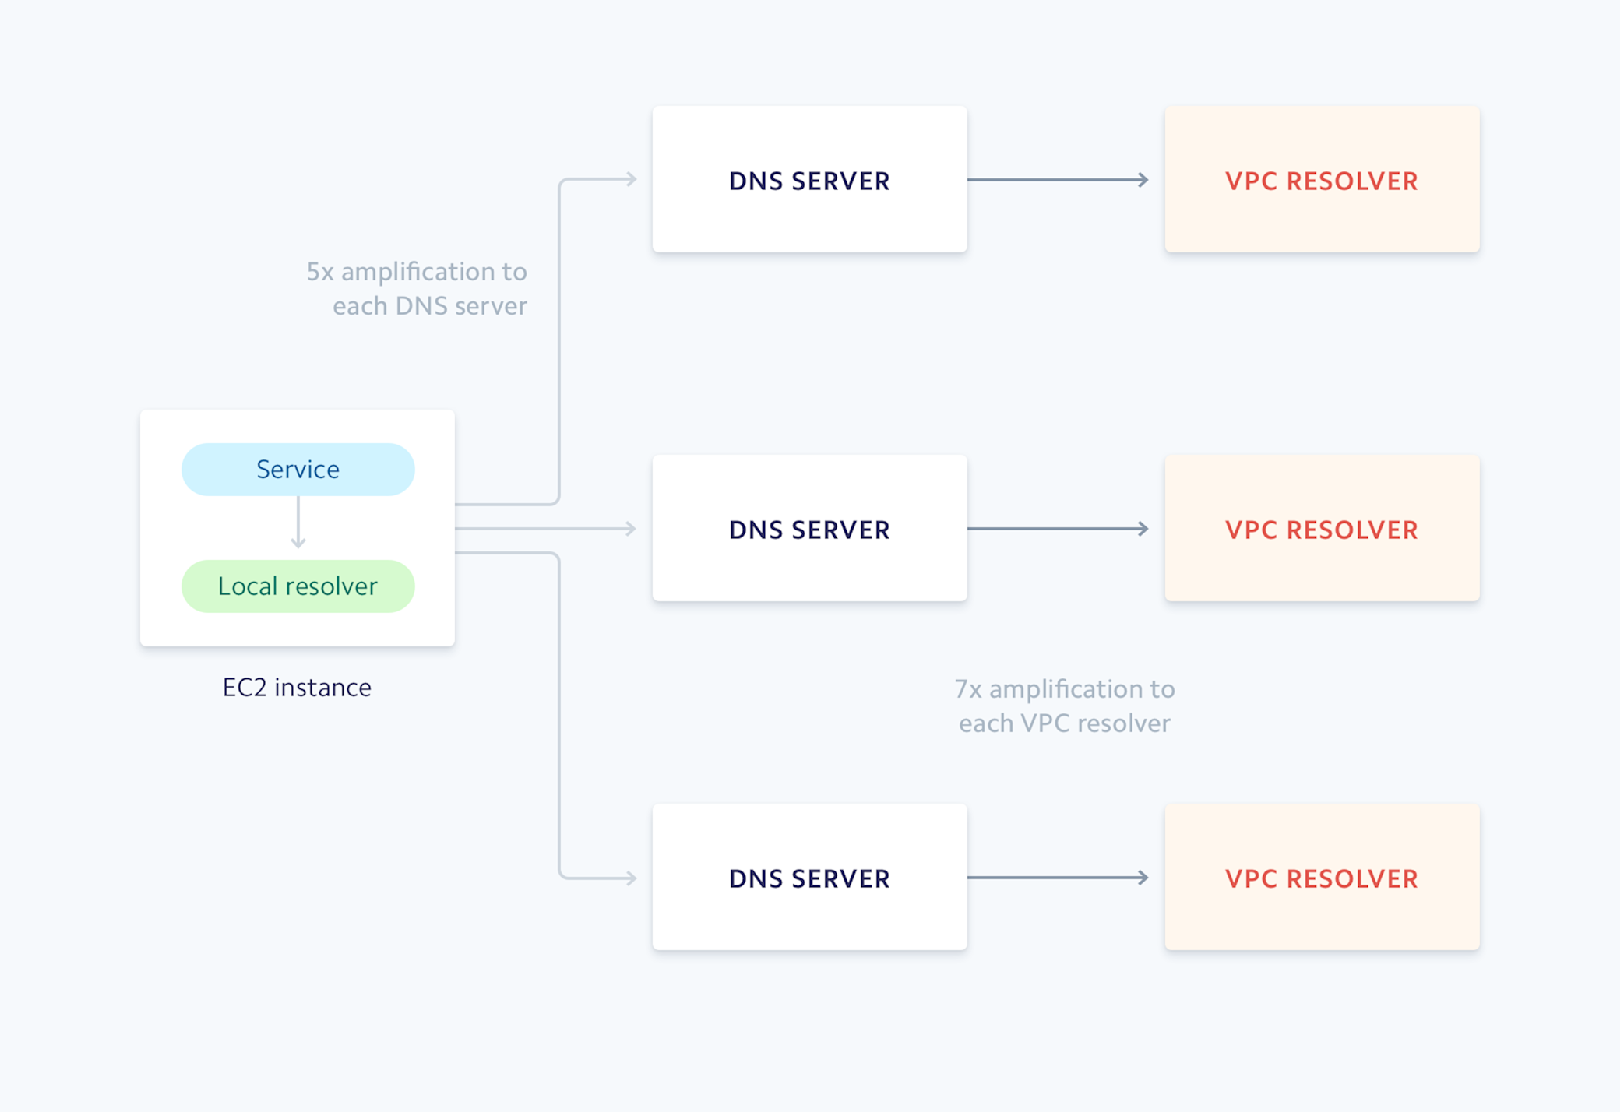
The data we saw from iptables (the number of packets per second sent to the VPC resolver) indicated a significant increase in traffic to the VPC resolvers during these periods, and we wanted to better understand what was happening. Taking a closer look at the shape of the traffic coming into the DNS servers from the Hadoop job, we noticed the clients were sending the request five times for every failed reverse lookup. Since the reverse lookups were taking so long or being dropped at the server, the local caching resolver on each host was timing out and continually retrying the requests. On top of this, the DNS servers were also retrying requests, leading to request volume amplifying by an average of 7x.

Spreading the load
One thing to remember is that the VPC resolver limit is imposed per network interface. Instead of performing the reverse lookups solely on our DNS servers, we could instead distribute the load and have each host contact the VPC resolver independently. With Unbound running on each host we can easily control this behavior. Unbound allows you to specify different forwarding rules per DNS zone. Reverse queries use the special domain in-addr.arpa, so configuring this behavior was a matter of adding a rule that forwards requests for this zone to the VPC resolver.
We knew that reverse lookups for private addresses stored in Route 53 would likely return faster than reverse lookups for public IPs that required communication with an external nameserver. So we decided to create two forwarding configurations, one for resolving private addresses (the 10.in-addr.arpa. zone) and one for all other reverse queries (the .in-addr.arpa. zone). Both rules were configured to send requests to the VPC resolver. Unbound calculates retry timeouts based on a smoothed average of historical round trip times to upstream servers and maintains separate calculations per forwarding rule. Even if two rules share the same upstream destination the retry timeouts are computed independently, which helps isolate the impact of inconsistent query performance on timeout calculations.
After applying the forwarding configuration change to the local Unbound resolvers on the Hadoop nodes we saw that the hourly load spike to the VPC resolvers had gone away, eliminating the surge of SERVFAILS we were seeing:

Adding the VPC resolver packet rate metric gives us a more complete picture of what’s going on in our DNS infrastructure. It alerts us if we approach any resource limits and points us in the right direction when systems are unhealthy. Some other improvements we’re considering include collecting a rolling tcpdump of DNS traffic and periodically logging the output of some of Unbound’s debugging commands, such as the contents of the request list.
Visibility into complex systems
When operating such a critical piece of infrastructure like DNS, it’s crucial to understand the health of the various components of the system. The metrics and command line tools that Unbound provides gives us great visibility into one of the core components of our DNS systems. As we saw in this scenario, these types of investigations often uncover areas where monitoring can be improved, and it’s important to address these gaps to better prepare for incident response. Gathering data from multiple sources allows you to see what’s going on in the system from different angles, which can help you narrow in on the root cause during an investigation. This information will also identify if the remediations you put in place have the intended effect. As these systems grow to handle more scale and increase in complexity, how you monitor them must also evolve to understand how different components interact with each other and build confidence that your systems are operating effectively.
